OPEN-SOURCE SCRIPT
Kill Zone Max Volume Candle Lines
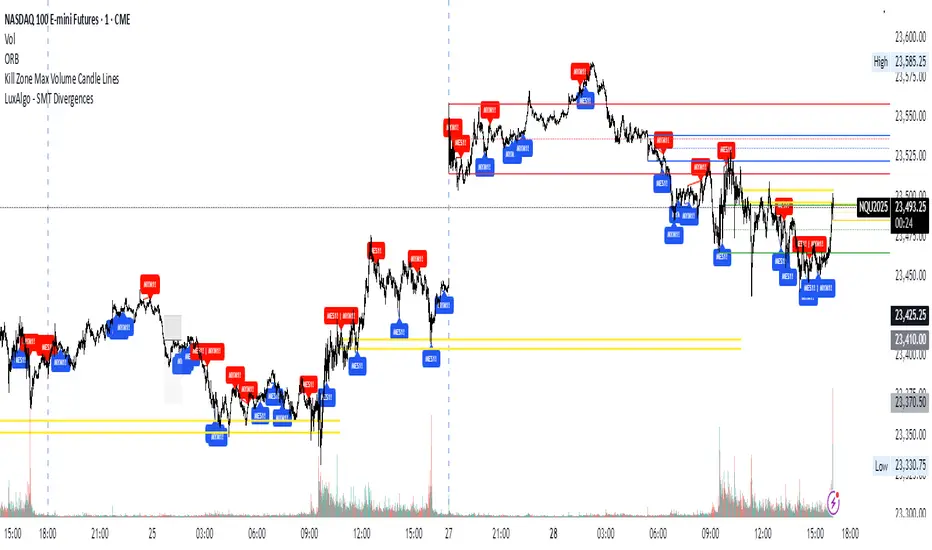
The Kill Zone Max Volume Lines indicator identifies the highest-volume candle within four key market sessions (Asia, London, NY AM, NY PM) and plots horizontal lines at its high, low, and midpoint levels, extended to the right.
Designed for traders targeting zones of heightened activity, this indicator highlights dynamic support and resistance levels based on volume—ideal for breakout or bounce strategies during highly volatile periods known as “kill zones.”
Perfect for indices such as Nasdaq (NQ), S&P 500 (SP), and Dow Jones (YM) on 15-minute or higher timeframes.
สคริปต์โอเพนซอร์ซ
ด้วยเจตนารมณ์หลักของ TradingView ผู้สร้างสคริปต์นี้ได้ทำให้มันเป็นโอเพ่นซอร์ส เพื่อให้เทรดเดอร์สามารถตรวจสอบและยืนยันการทำงานของสคริปต์ได้ ขอแสดงความชื่นชมผู้เขียน! แม้ว่าคุณจะสามารถใช้งานได้ฟรี แต่อย่าลืมว่าการเผยแพร่โค้ดซ้ำนั้นจะต้องเป็นไปตามกฎระเบียบการใช้งานของเรา
คำจำกัดสิทธิ์ความรับผิดชอบ
ข้อมูลและบทความไม่ได้มีวัตถุประสงค์เพื่อก่อให้เกิดกิจกรรมทางการเงิน, การลงทุน, การซื้อขาย, ข้อเสนอแนะ หรือคำแนะนำประเภทอื่น ๆ ที่ให้หรือรับรองโดย TradingView อ่านเพิ่มเติมที่ ข้อกำหนดการใช้งาน