PROTECTED SOURCE SCRIPT
ที่อัปเดต: PVA Volume
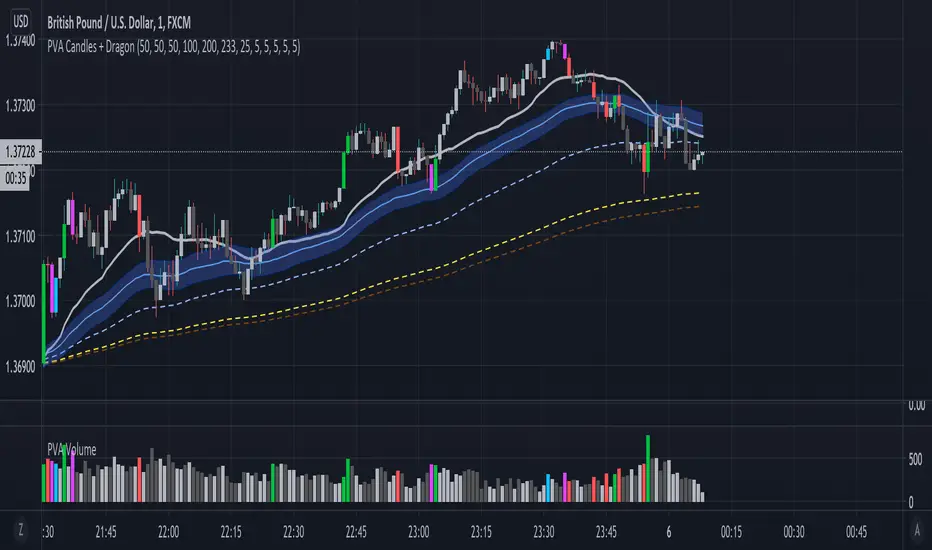
The PVA volume is part of PVSRA and it shows different bar colors according to the conditions below.
Situation "Climax". When volume >= 200% of the average volume of the 10
previous chart candles or where the product of candle spread x candle volume is >= the
highest for the 10 previous chart candles. Default Colors: Bullish bars are green and
Bearish bars are red.
Situation "Volume Rising Above Average". When volume >= 150% of the average
volume of the 10 previous chart candles. Default Colors: Bullish bars are blue and bearish bars are
blue-violet.
เอกสารเผยแพร่
I changed the transparency to zero so that the volume bar becomes more visible and so that it resembles the original PVSRA script.สคริปต์ที่ได้รับการป้องกัน
สคริปต์นี้ถูกเผยแพร่เป็นแบบ closed-source อย่างไรก็ตาม คุณสามารถใช้ได้อย่างอิสระและไม่มีข้อจำกัดใดๆ – เรียนรู้เพิ่มเติมได้ที่นี่
คำจำกัดสิทธิ์ความรับผิดชอบ
ข้อมูลและบทความไม่ได้มีวัตถุประสงค์เพื่อก่อให้เกิดกิจกรรมทางการเงิน, การลงทุน, การซื้อขาย, ข้อเสนอแนะ หรือคำแนะนำประเภทอื่น ๆ ที่ให้หรือรับรองโดย TradingView อ่านเพิ่มเติมใน ข้อกำหนดการใช้งาน
สคริปต์ที่ได้รับการป้องกัน
สคริปต์นี้ถูกเผยแพร่เป็นแบบ closed-source อย่างไรก็ตาม คุณสามารถใช้ได้อย่างอิสระและไม่มีข้อจำกัดใดๆ – เรียนรู้เพิ่มเติมได้ที่นี่
คำจำกัดสิทธิ์ความรับผิดชอบ
ข้อมูลและบทความไม่ได้มีวัตถุประสงค์เพื่อก่อให้เกิดกิจกรรมทางการเงิน, การลงทุน, การซื้อขาย, ข้อเสนอแนะ หรือคำแนะนำประเภทอื่น ๆ ที่ให้หรือรับรองโดย TradingView อ่านเพิ่มเติมใน ข้อกำหนดการใช้งาน