OPEN-SOURCE SCRIPT
Dynamic 50% Indicator of the selected range!
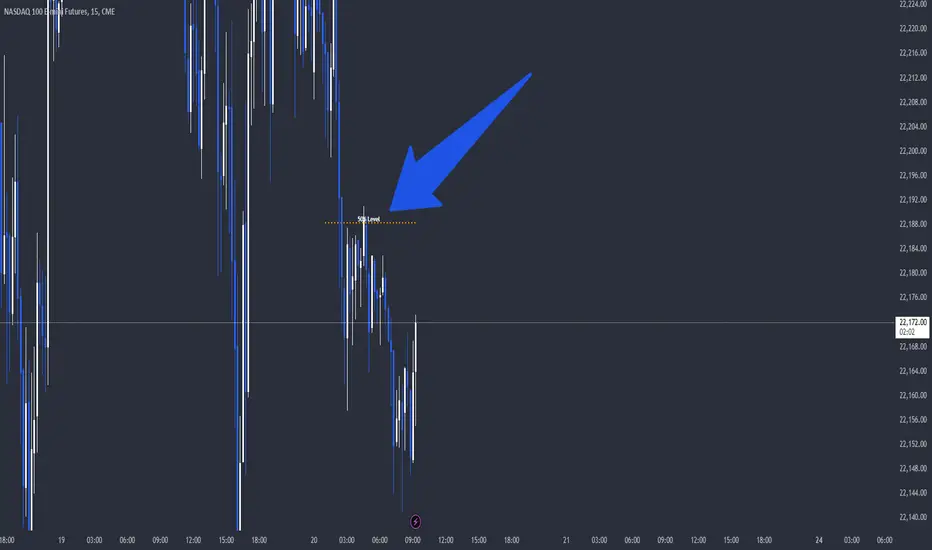
This is a indicator which shows you the 50% level of the selected timeframe range. This is a good tool because price tends to bounce of of 50% levels.
Introducing the 50% Range Level Indicator, designed for traders who seek accuracy and strategic insights in their market analysis. This tool calculates and visually displays the midpoint (50% level) of any selected price range, helping you identify key equilibrium zones where price action often reacts.
Why Use This Indicator?
Key Market Equilibrium – The 50% level is a crucial reference point where price often consolidates, reverses, or gathers momentum.
Custom Range Selection – Simply select your desired price range, and the indicator will dynamically plot the midpoint.
Enhance Your Trading Strategy – Use it for support & resistance confirmation, retracement analysis, or confluence with other indicators.
Works on All Timeframes & Assets – Suitable for stocks, forex, crypto, and indices.
Gain an Edge in the Market
Whether you’re a day trader, swing trader, or long-term investor, the 50% Range Level Indicator can enhance your technical analysis and decision-making.
สคริปต์โอเพนซอร์ซ
ด้วยเจตนารมณ์หลักของ TradingView ผู้สร้างสคริปต์นี้ได้ทำให้เป็นโอเพนซอร์ส เพื่อให้เทรดเดอร์สามารถตรวจสอบและยืนยันฟังก์ชันการทำงานของมันได้ ขอชื่นชมผู้เขียน! แม้ว่าคุณจะใช้งานได้ฟรี แต่โปรดจำไว้ว่าการเผยแพร่โค้ดซ้ำจะต้องเป็นไปตาม กฎระเบียบการใช้งาน ของเรา
คำจำกัดสิทธิ์ความรับผิดชอบ
ข้อมูลและบทความไม่ได้มีวัตถุประสงค์เพื่อก่อให้เกิดกิจกรรมทางการเงิน, การลงทุน, การซื้อขาย, ข้อเสนอแนะ หรือคำแนะนำประเภทอื่น ๆ ที่ให้หรือรับรองโดย TradingView อ่านเพิ่มเติมใน ข้อกำหนดการใช้งาน