OPEN-SOURCE SCRIPT
DSL Oscillator [BigBeluga]
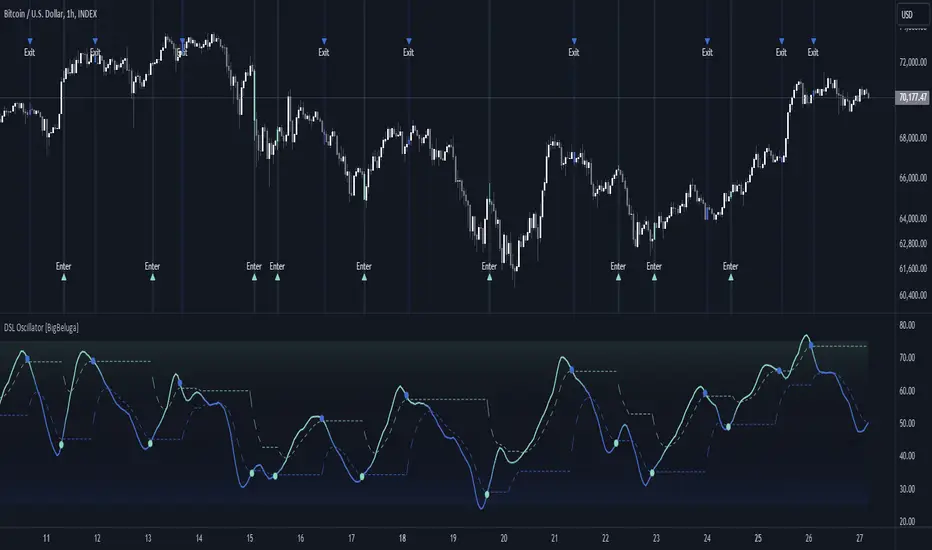
DSL Oscillator BigBeluga
The DSL (Discontinued Signal Lines) Oscillator is an advanced technical analysis tool that combines elements of the Relative Strength Index (RSI), Discontinued Signal Lines, and Zero-Lag Exponential Moving Average (ZLEMA). This versatile indicator is designed to help traders identify trend direction, momentum, and potential reversal points in the market.
What are Discontinued Signal Lines (DSL)?
Discontinued Signal Lines are an extension of the traditional signal line concept used in many indicators. While a standard signal line compares an indicator's value to its smoothed (slightly lagging) state, DSL takes this idea further by using multiple adaptive lines that respond to the indicator's current value. This approach provides a more nuanced view of the indicator's state and momentum, making it easier to determine trends and desired states of the indicator.
🔵KEY FEATURES
● Discontinued Signal Lines (DSL)
● DSL Oscillator
● Signal Generation

● Visual Cues
🔵HOW TO USE
● Trend Identification

● Entry Signals
● Exit Signals

● Momentum Analysis

● Confirmation
🔵CUSTOMIZATION
The DSL Oscillator offers several customization options:
The DSL (Discontinued Signal Lines) Oscillator is an advanced technical analysis tool that combines elements of the Relative Strength Index (RSI), Discontinued Signal Lines, and Zero-Lag Exponential Moving Average (ZLEMA). This versatile indicator is designed to help traders identify trend direction, momentum, and potential reversal points in the market.
What are Discontinued Signal Lines (DSL)?
Discontinued Signal Lines are an extension of the traditional signal line concept used in many indicators. While a standard signal line compares an indicator's value to its smoothed (slightly lagging) state, DSL takes this idea further by using multiple adaptive lines that respond to the indicator's current value. This approach provides a more nuanced view of the indicator's state and momentum, making it easier to determine trends and desired states of the indicator.
🔵KEY FEATURES
● Discontinued Signal Lines (DSL)
- Uses multiple adaptive lines that respond to the indicator's value
- Provides a more nuanced view of the indicator's state and momentum
- Helps determine trends and desired states of the indicator more effectively
- Available in "Fast" and "Slow" modes for different responsiveness
- Acts as dynamic support and resistance levels for the oscillator
● DSL Oscillator
- Based on a combination of RSI and Discontinued Signal Lines
Pine Script® // Discontinued Signal Lines dsl_lines(src, length)=> UP = 0. DN = 0. UP := (src > ta.sma(src, length)) ? nz(UP[1]) + dsl_mode / length * (src - nz(UP[1])) : nz(UP[1]) DN := (src < ta.sma(src, length)) ? nz(DN[1]) + dsl_mode / length * (src - nz(DN[1])) : nz(DN[1]) [UP, DN] - Smoothed using Zero-Lag Exponential Moving Average for reduced lag
Pine Script® // Zero-Lag Exponential Moving Average function zlema(src, length) => lag = math.floor((length - 1) / 2) ema_data = 2 * src - src[lag] ema2 = ta.ema(ema_data, length) ema2 - Oscillates between 0 and 100
- Color-coded for easy interpretation of market conditions
● Signal Generation
- Generates buy signals when the oscillator crosses above the lower DSL line below 50
- Generates sell signals when the oscillator crosses below the upper DSL line above 50
- Signals are visualized on both the oscillator and the main chart
● Visual Cues
- Background color changes on signal occurrences for easy identification
- Candles on the main chart are colored based on the latest signal
- Oscillator line color changes based on its position relative to the DSL lines
🔵HOW TO USE
● Trend Identification
- Use the color and position of the DSL Oscillator relative to its Discontinued Signal Lines to determine the overall market trend
● Entry Signals
- Look for buy signals (green circles) when the oscillator crosses above the lower DSL line
- Look for sell signals (blue circles) when the oscillator crosses below the upper DSL line
- Confirm signals with the triangles on the main chart and background color changes
● Exit Signals
- Consider exiting long positions on exit signals and short positions on Entery signals
- Watch for the oscillator crossing back between the DSL lines as a potential early exit signal
● Momentum Analysis
- Strong momentum is indicated when the oscillator moves rapidly towards extremes and away from the DSL lines
- Weakening momentum can be spotted when the oscillator struggles to reach new highs or lows, or starts converging with the DSL lines
- The space between the DSL lines can indicate potential momentum strength - wider gaps suggest stronger trends
● Confirmation
- Use the DSL lines as dynamic support/resistance levels for the oscillator
- Look for convergence between oscillator signals and price action on the main chart
- Combine signals with other technical indicators or chart patterns for stronger confirmation
🔵CUSTOMIZATION
The DSL Oscillator offers several customization options:
- Adjust the main calculation length for the DSL lines
- Choose between "Fast" and "Slow" modes for the DSL lines calculation
By fine-tuning these settings, traders can adapt the DSL Oscillator to various market conditions and personal trading strategies.
The DSL Oscillator provides a multi-faceted approach to market analysis, combining trend identification, momentum assessment, and signal generation in one comprehensive tool. Its dynamic nature and visual cues make it suitable for both novice and experienced traders across various timeframes and markets. The integration of RSI, Discontinued Signal Lines, and ZLEMA offers traders a sophisticated yet intuitive tool to inform their trading decisions.
The use of Discontinued Signal Lines sets this oscillator apart from traditional indicators by providing a more adaptive and nuanced view of market conditions. This can potentially lead to more accurate trend identification and signal generation, especially in markets with varying volatility.
Traders can use the DSL Oscillator to identify trends, spot potential reversals, and gauge market momentum. The combination of the oscillator, dynamic signal lines, and clear visual signals provides a holistic view of market conditions. As with all technical indicators, it's recommended to use the DSL Oscillator in conjunction with other forms of analysis and within the context of a well-defined trading strategy.
สคริปต์โอเพนซอร์ซ
ด้วยเจตนารมณ์หลักของ TradingView ผู้สร้างสคริปต์นี้ได้ทำให้เป็นโอเพนซอร์ส เพื่อให้เทรดเดอร์สามารถตรวจสอบและยืนยันฟังก์ชันการทำงานของมันได้ ขอชื่นชมผู้เขียน! แม้ว่าคุณจะใช้งานได้ฟรี แต่โปรดจำไว้ว่าการเผยแพร่โค้ดซ้ำจะต้องเป็นไปตาม กฎระเบียบการใช้งาน ของเรา
🔵Gain access to our powerful tools : bigbeluga.com/tv
🔵Join our free discord for updates : bigbeluga.com/discord
All scripts & content provided by BigBeluga are for informational & educational purposes only.
🔵Join our free discord for updates : bigbeluga.com/discord
All scripts & content provided by BigBeluga are for informational & educational purposes only.
คำจำกัดสิทธิ์ความรับผิดชอบ
ข้อมูลและบทความไม่ได้มีวัตถุประสงค์เพื่อก่อให้เกิดกิจกรรมทางการเงิน, การลงทุน, การซื้อขาย, ข้อเสนอแนะ หรือคำแนะนำประเภทอื่น ๆ ที่ให้หรือรับรองโดย TradingView อ่านเพิ่มเติมใน ข้อกำหนดการใช้งาน