PROTECTED SOURCE SCRIPT
Daily RVOL (Cumulative with Multi Alerts)
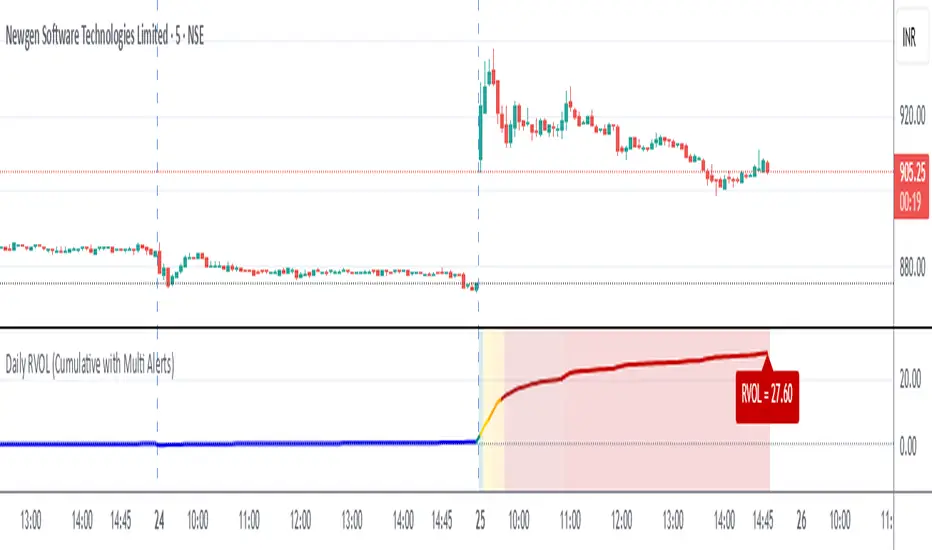
Daily RVOL (Cumulative with Multi Alerts)
This indicator plots Relative Volume (RVOL) on intraday charts by comparing today’s cumulative traded volume with either:
The average daily volume of the past N days (default 5), or
Yesterday’s total daily volume (selectable from settings).
Unlike per-candle RVOL indicators, this version tracks cumulative intraday RVOL that only increases throughout the trading day. This matches how professional scanners (like Chartink/Gocharting) calculate RVOL, e.g. RVOL = 6 at open → 12 → 20 → 45 by end of day.
สคริปต์ที่ได้รับการป้องกัน
สคริปต์นี้ถูกเผยแพร่เป็นแบบ closed-source อย่างไรก็ตาม คุณสามารถใช้ได้อย่างอิสระและไม่มีข้อจำกัดใดๆ – เรียนรู้เพิ่มเติมได้ที่นี่
คำจำกัดสิทธิ์ความรับผิดชอบ
ข้อมูลและบทความไม่ได้มีวัตถุประสงค์เพื่อก่อให้เกิดกิจกรรมทางการเงิน, การลงทุน, การซื้อขาย, ข้อเสนอแนะ หรือคำแนะนำประเภทอื่น ๆ ที่ให้หรือรับรองโดย TradingView อ่านเพิ่มเติมใน ข้อกำหนดการใช้งาน