PROTECTED SOURCE SCRIPT
OGT Bollinger Bands Trend Indicator
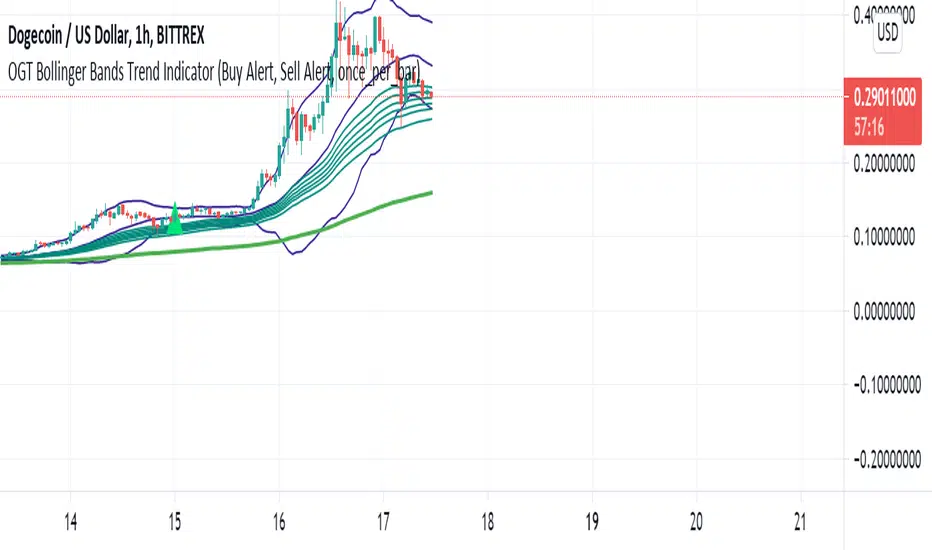
What Is The OGT Bollinger Bands Trend Indicator?
This indicator is a pullback trend trading indicator which uses the following indicators:
- 200 EMA - Long Term Trend Direction
- 30, 35, 40, 45, 50, 60 EMAs - Shorter Term Trend Direction
- Bollinger Bands - Pullback / Entry Signal
How Are Signals Generated?
Buy
- Price above the 200 EMA
- Price touches lower BB with shorter term EMAs all aligned (not crossed)
- Indicator waits for price to close above midpoint BB with shorter term EMAs all still aligned (not crossed)
Sell
- Price below the 200 EMA
- Price touches upper BB with shorter term EMAs all aligned (not crossed)
- Indicator waits for price to close above midpoint BB with shorter term EMAs all still aligned (not crossed)
Alerts function built in, input settings customisable to show/not show indicators and change colours.
สคริปต์ที่ได้รับการป้องกัน
สคริปต์นี้ถูกเผยแพร่เป็นแบบ closed-source อย่างไรก็ตาม คุณสามารถใช้ได้อย่างอิสระและไม่มีข้อจำกัดใดๆ – เรียนรู้เพิ่มเติมได้ที่นี่
คำจำกัดสิทธิ์ความรับผิดชอบ
ข้อมูลและบทความไม่ได้มีวัตถุประสงค์เพื่อก่อให้เกิดกิจกรรมทางการเงิน, การลงทุน, การซื้อขาย, ข้อเสนอแนะ หรือคำแนะนำประเภทอื่น ๆ ที่ให้หรือรับรองโดย TradingView อ่านเพิ่มเติมใน ข้อกำหนดการใช้งาน