OPEN-SOURCE SCRIPT
Current RSI vs Sector RSI Comparison
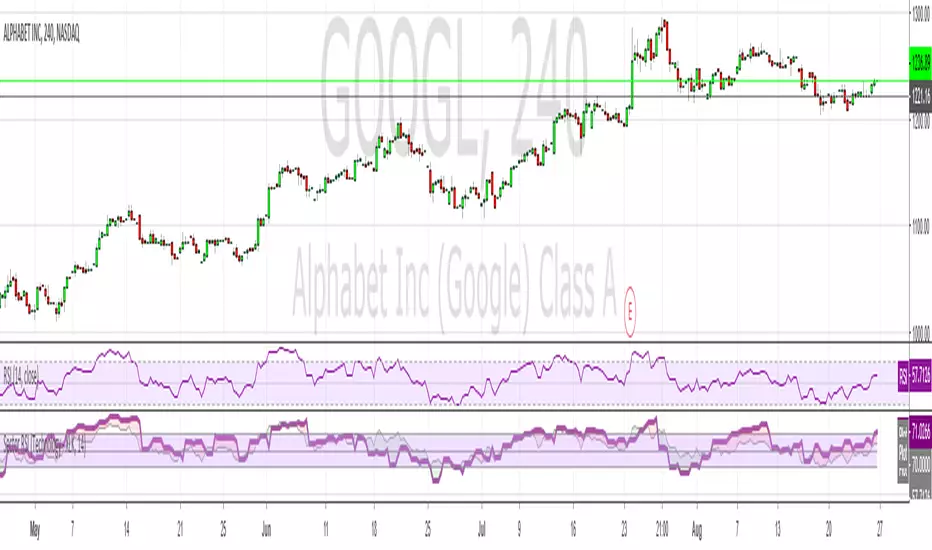
In the example above GOOGL's RSI is being compared against the RSI for XLK, the technology sector fund. The red and green areas make it easy to see if Google is under or overperforming relative to other tech stocks. I've included a normal RSI above it for comparison.
You can compare any stock to a sector, i.e. JP Morgan (JPM) versus the financial sector (XLF), or whatever your heart desires. All major sectors are selectable from a drop-down box and the output can also be visualised as a histogram too, much like a MACD.
You can compare any stock to a sector, i.e. JP Morgan (JPM) versus the financial sector (XLF), or whatever your heart desires. All major sectors are selectable from a drop-down box and the output can also be visualised as a histogram too, much like a MACD.
สคริปต์โอเพนซอร์ซ
ด้วยเจตนารมณ์หลักของ TradingView ผู้สร้างสคริปต์นี้ได้ทำให้เป็นโอเพนซอร์ส เพื่อให้เทรดเดอร์สามารถตรวจสอบและยืนยันฟังก์ชันการทำงานของมันได้ ขอชื่นชมผู้เขียน! แม้ว่าคุณจะใช้งานได้ฟรี แต่โปรดจำไว้ว่าการเผยแพร่โค้ดซ้ำจะต้องเป็นไปตาม กฎระเบียบการใช้งาน ของเรา
คำจำกัดสิทธิ์ความรับผิดชอบ
ข้อมูลและบทความไม่ได้มีวัตถุประสงค์เพื่อก่อให้เกิดกิจกรรมทางการเงิน, การลงทุน, การซื้อขาย, ข้อเสนอแนะ หรือคำแนะนำประเภทอื่น ๆ ที่ให้หรือรับรองโดย TradingView อ่านเพิ่มเติมใน ข้อกำหนดการใช้งาน