OPEN-SOURCE SCRIPT
Multi Market Structure Trend

OVERVIEW
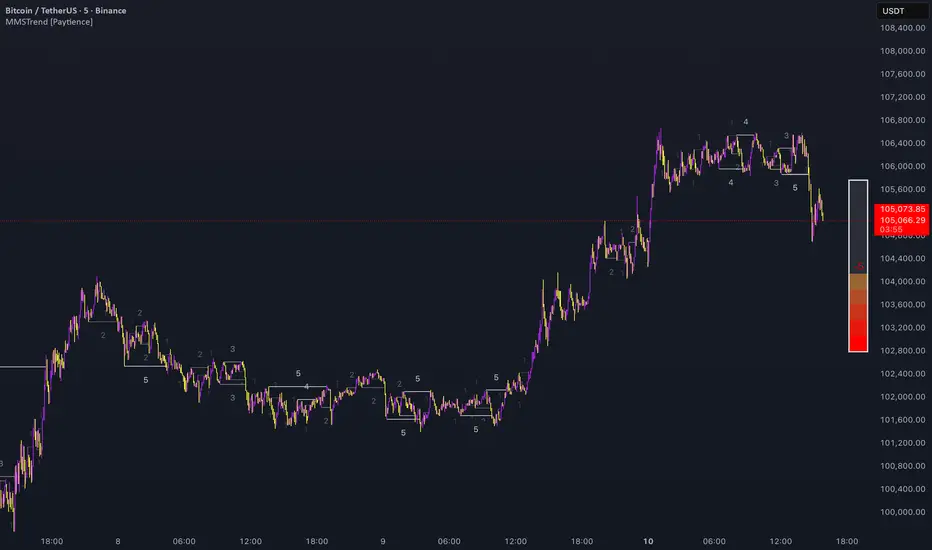
Multi Market Structure Trend [Paytience] is a multi-layered market structure analyzer that detects trend shifts across five independent pivot-based structures. Each pivot uses a different lookback length, offering a comprehensive view of structural momentum from short-term to long-term.
The indicator visually displays the net trend direction using colored candlesticks and a dynamic gauge that tracks how many of the 5 market structure layers are currently bullish or bearish.
⯁ STRUCTURE TRACKING SYSTEM
The indicator tracks five separate market structure layers in parallel using pivot-based breakouts. Each one can be individually enabled or disabled.
Each structure works as follows:
⯁ CANDLE COLOR GRADIENT SYSTEM
The indicator calculates the average directional bias from all enabled market structures to determine the current trend score.
⯁ TREND GAUGE PANEL
Displayed at the middle-right side of the chart, the gauge shows the current trend strength in real time.
⯁ USAGE
This indicator is highly effective for traders who want to:
⯁ CONCLUSION
Multi Market Structure Trend [Paytience] offers a unique and powerful way to assess trend direction using stacked market structure logic. With five independently calculated structure layers, colored candle feedback, and a real-time trend gauge, traders can better time entries, filter noise, and confirm multi-timeframe alignment — all within a single chart overlay.
Multi Market Structure Trend [Paytience] is a multi-layered market structure analyzer that detects trend shifts across five independent pivot-based structures. Each pivot uses a different lookback length, offering a comprehensive view of structural momentum from short-term to long-term.
The indicator visually displays the net trend direction using colored candlesticks and a dynamic gauge that tracks how many of the 5 market structure layers are currently bullish or bearish.
⯁ STRUCTURE TRACKING SYSTEM
The indicator tracks five separate market structure layers in parallel using pivot-based breakouts. Each one can be individually enabled or disabled.
Each structure works as follows:
- A bullish MSB (Market Structure Break) occurs when price breaks above the most recent swing high.
- A bearish MSB occurs when price breaks below the most recent swing low.
- Structure breaks are plotted as horizontal lines and labeled with the number (1 to 5) corresponding to their pivot layer.
⯁ CANDLE COLOR GRADIENT SYSTEM
The indicator calculates the average directional bias from all enabled market structures to determine the current trend score.
- Each structure contributes a score of +1 for bullish and -1 for bearish.
- The total score ranges from -5 (all bearish) to +5 (all bullish).
- Candlesticks are colored using a smooth gradient:
- Bright Green: Strong bullish trend (e.g., +5).
- Orange: Neutral mixed trend (e.g., 0).
- Red: Strong bearish trend (e.g., -5).
- Bright Green: Strong bullish trend (e.g., +5).
⯁ TREND GAUGE PANEL
Displayed at the middle-right side of the chart, the gauge shows the current trend strength in real time.
- The bar consists of up to 10 gradient cells (5 up, 5 down).
- Each active market structure pushes the score in one direction.
- The central cell displays a numeric trend score:
- +5 = All 5 market structures bullish
- 0 = Mixed/neutral trend
- -5 = All 5 market structures bearish
- Colors of the gauge bars match the candle gradient system.
⯁ USAGE
This indicator is highly effective for traders who want to:
- Monitor short- and long-term structure shifts simultaneously on a single chart.
- Use structure alignment as a trend confirmation tool — for example, waiting for at least 2 out of 5 structures to align before entering a trade.
- Visually filter noise from different time horizons using the gauge and candle gradient.
- Track CHoCH (Change of Character) transitions clearly and across multiple scales.
⯁ CONCLUSION
Multi Market Structure Trend [Paytience] offers a unique and powerful way to assess trend direction using stacked market structure logic. With five independently calculated structure layers, colored candle feedback, and a real-time trend gauge, traders can better time entries, filter noise, and confirm multi-timeframe alignment — all within a single chart overlay.
สคริปต์โอเพนซอร์ซ
ด้วยเจตนารมณ์หลักของ TradingView ผู้สร้างสคริปต์นี้ได้ทำให้เป็นโอเพนซอร์ส เพื่อให้เทรดเดอร์สามารถตรวจสอบและยืนยันฟังก์ชันการทำงานของมันได้ ขอชื่นชมผู้เขียน! แม้ว่าคุณจะใช้งานได้ฟรี แต่โปรดจำไว้ว่าการเผยแพร่โค้ดซ้ำจะต้องเป็นไปตาม กฎระเบียบการใช้งาน ของเรา
Get Access To Our Premium Paytience Indicators: paytience.io
All scripts & content provided by Paytience are for informational & educational purposes only. Past performance does not guarantee future results. 🦉
All scripts & content provided by Paytience are for informational & educational purposes only. Past performance does not guarantee future results. 🦉
คำจำกัดสิทธิ์ความรับผิดชอบ
ข้อมูลและบทความไม่ได้มีวัตถุประสงค์เพื่อก่อให้เกิดกิจกรรมทางการเงิน, การลงทุน, การซื้อขาย, ข้อเสนอแนะ หรือคำแนะนำประเภทอื่น ๆ ที่ให้หรือรับรองโดย TradingView อ่านเพิ่มเติมใน ข้อกำหนดการใช้งาน