OPEN-SOURCE SCRIPT
XRP Comparative RSI Indicator - Final Version
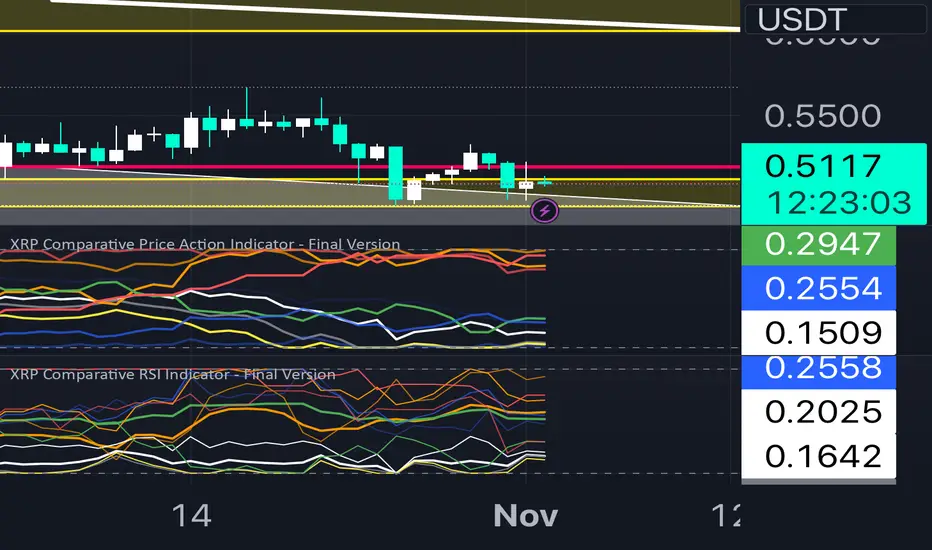
XRP Comparative RSI Indicator - Final Version
The XRP Comparative RSI Indicator offers a dynamic analysis of XRP’s market positioning through relative strength index (RSI) comparisons across various cryptocurrencies and major market indicators. This indicator allows traders and analysts to gauge XRP’s momentum and potential turning points within different market conditions.
Key Features:
• Normalized RSIs: Each RSI value is normalized between 0.00 and 1.00, allowing seamless comparison across multiple assets.
• Grouped Analysis: Three RSI groups provide specific insights:
• Group 1 (XRP-Specific): Measures XRPUSD, XRP Dominance (XRP.D), and XRP/BTC, focusing on XRP’s performance across different trading pairs.
• Group 2 (Market Influence - Bitcoin): Measures BTCUSD, BTC Dominance (BTC.D), and XRP/BTC, capturing the influence of Bitcoin on XRP.
• Group 3 (Liquidity Impact): Measures USDT Dominance (USDT.D), BTCUSD, and ETHUSD, evaluating the liquidity impact from key assets and stablecoins.
• Individual Asset RSIs: Track the normalized RSI for each specific pair or asset, including XRPUSD, BTCUSD, ETHUSD, XRP/BTC, BTC Dominance, ETH Dominance, and the S&P 500.
• Clear Color Coding: Each asset’s RSI is plotted with a unique color scheme, consistent with the first indicator, for easy recognition.
This indicator is ideal for identifying relative strengths, potential entry and exit signals, and understanding how XRP’s momentum aligns or diverges from broader market trends.
สคริปต์โอเพนซอร์ซ
ด้วยเจตนารมณ์หลักของ TradingView ผู้สร้างสคริปต์นี้ได้ทำให้เป็นโอเพนซอร์ส เพื่อให้เทรดเดอร์สามารถตรวจสอบและยืนยันฟังก์ชันการทำงานของมันได้ ขอชื่นชมผู้เขียน! แม้ว่าคุณจะใช้งานได้ฟรี แต่โปรดจำไว้ว่าการเผยแพร่โค้ดซ้ำจะต้องเป็นไปตาม กฎระเบียบการใช้งาน ของเรา
คำจำกัดสิทธิ์ความรับผิดชอบ
ข้อมูลและบทความไม่ได้มีวัตถุประสงค์เพื่อก่อให้เกิดกิจกรรมทางการเงิน, การลงทุน, การซื้อขาย, ข้อเสนอแนะ หรือคำแนะนำประเภทอื่น ๆ ที่ให้หรือรับรองโดย TradingView อ่านเพิ่มเติมใน ข้อกำหนดการใช้งาน