OPEN-SOURCE SCRIPT
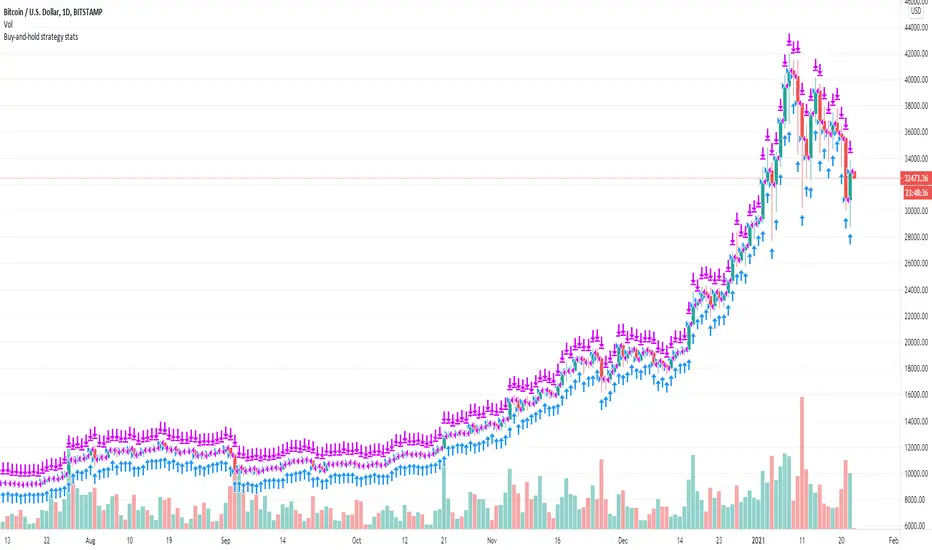
Buy-and-hold strategy stats

When you develop your own strategy you should compare its performance to the "buy-and-hold" strategy (you buy the financial instrument and you hold it long term). Ideally your strategy should perform better than the buy-and-hold strategy. While the net profit % of the buy-and-hold strategy is available under the "Performance Summary" tab of the "Strategy Tester" there are other factors that should be considered though. This is where this strategy comes in. It mimics the buy-and-hold strategy and gives you all the stats that are available for any strategy. For example, one such criteria that should be considered is the max. drawdown. Even if you strategy performs worse than the buy-and-hold strategy in terms of net profit, if the max. drawdown of your strategy is considerably lower than that of the buy-and-hold it may overall be a better strategy than the buy-and-hold as, in this scenario, it likely exposes the investor to significantly less risk.
สคริปต์โอเพนซอร์ซ
ด้วยเจตนารมณ์หลักของ TradingView ผู้สร้างสคริปต์นี้ได้ทำให้เป็นโอเพนซอร์ส เพื่อให้เทรดเดอร์สามารถตรวจสอบและยืนยันฟังก์ชันการทำงานของมันได้ ขอชื่นชมผู้เขียน! แม้ว่าคุณจะใช้งานได้ฟรี แต่โปรดจำไว้ว่าการเผยแพร่โค้ดซ้ำจะต้องเป็นไปตาม กฎระเบียบการใช้งาน ของเรา
Join free discord.gg/wDTkRnS or t.me/TradersForecast
คำจำกัดสิทธิ์ความรับผิดชอบ
ข้อมูลและบทความไม่ได้มีวัตถุประสงค์เพื่อก่อให้เกิดกิจกรรมทางการเงิน, การลงทุน, การซื้อขาย, ข้อเสนอแนะ หรือคำแนะนำประเภทอื่น ๆ ที่ให้หรือรับรองโดย TradingView อ่านเพิ่มเติมใน ข้อกำหนดการใช้งาน