OPEN-SOURCE SCRIPT
ka66: Externally-Sourced MACD
This indicator generalises the idea of MACD to take any arbitrary series available on the chart, using input.source values.
To provide an overview of the MACD indicator:
With this indicator, you can analyse momentum between any 2 series (not just EMAs), they could be raw close prices, other moving averages on the chart including specialised ones, that most MACD implementations won't provide a facility for, for example Kaufman Moving Average.
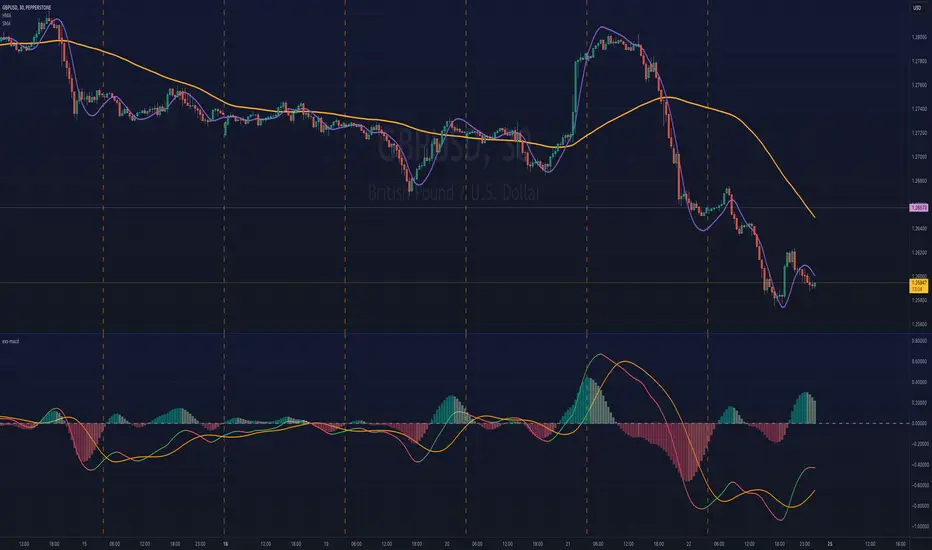
The chart shows this indicator sourcing 2 inputs from the chart:
It then calculates the MACD (Series1 - Series2), and a Signal line from the resulting MACD.
A signal series is still calculated manually by the indicator, and thus will be restricted to the provided moving average options (this indicator provides a few like EMA, SMA, Hull, and so on).
Uses of this indicator are essentially what you will use a MACD for:
To provide an overview of the MACD indicator:
- You have two EMAs, one with a faster period, usually 12, another with a slower period, usually 26.
- You calculate a MACD line, by doing (fastEMA - slowEMA)
- You then calculate a Signal Line by taking a moving average of the MACD line over some period.
With this indicator, you can analyse momentum between any 2 series (not just EMAs), they could be raw close prices, other moving averages on the chart including specialised ones, that most MACD implementations won't provide a facility for, for example Kaufman Moving Average.
The chart shows this indicator sourcing 2 inputs from the chart:
- A Hull Moving Average as the fast series
- And a Simple Moving Average as the slow series
It then calculates the MACD (Series1 - Series2), and a Signal line from the resulting MACD.
A signal series is still calculated manually by the indicator, and thus will be restricted to the provided moving average options (this indicator provides a few like EMA, SMA, Hull, and so on).
Uses of this indicator are essentially what you will use a MACD for:
- Evaluate momentum of a strength.
- Crossover Signals: MACD vs. Signal, MACD vs. Zero Line, MACD Histogram gradation.
- Evaluate overbought/oversold conditions.
- As a low-resolution view to confirm price action.
- Divergences
สคริปต์โอเพนซอร์ซ
ด้วยเจตนารมณ์หลักของ TradingView ผู้สร้างสคริปต์นี้ได้ทำให้เป็นโอเพนซอร์ส เพื่อให้เทรดเดอร์สามารถตรวจสอบและยืนยันฟังก์ชันการทำงานของมันได้ ขอชื่นชมผู้เขียน! แม้ว่าคุณจะใช้งานได้ฟรี แต่โปรดจำไว้ว่าการเผยแพร่โค้ดซ้ำจะต้องเป็นไปตาม กฎระเบียบการใช้งาน ของเรา
คำจำกัดสิทธิ์ความรับผิดชอบ
ข้อมูลและบทความไม่ได้มีวัตถุประสงค์เพื่อก่อให้เกิดกิจกรรมทางการเงิน, การลงทุน, การซื้อขาย, ข้อเสนอแนะ หรือคำแนะนำประเภทอื่น ๆ ที่ให้หรือรับรองโดย TradingView อ่านเพิ่มเติมใน ข้อกำหนดการใช้งาน