OPEN-SOURCE SCRIPT
Pre-Market High and Low
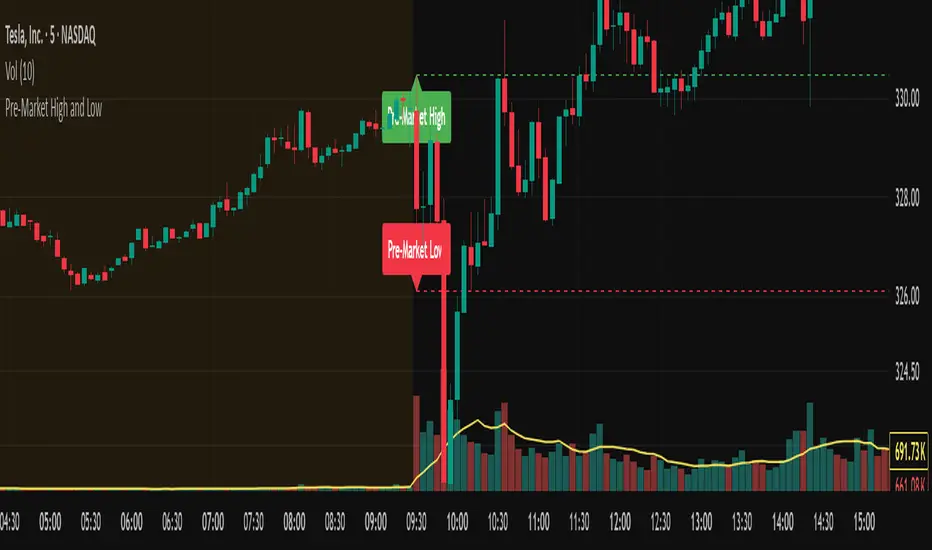
This indicator automatically tracks and plots the daily pre-market high and low levels on your chart for U.S. stocks. It monitors the pre-market session from 4:30 AM to 9:30 AM Eastern Time (New York) and captures the highest and lowest prices during this period.
At exactly 9:30 AM ET, when the regular market opens, the indicator draws dashed horizontal lines representing the pre-market high and pre-market low, extending them forward for better visibility throughout the trading day.
At exactly 9:30 AM ET, when the regular market opens, the indicator draws dashed horizontal lines representing the pre-market high and pre-market low, extending them forward for better visibility throughout the trading day.
สคริปต์โอเพนซอร์ซ
ด้วยเจตนารมณ์หลักของ TradingView ผู้สร้างสคริปต์นี้ได้ทำให้เป็นโอเพนซอร์ส เพื่อให้เทรดเดอร์สามารถตรวจสอบและยืนยันฟังก์ชันการทำงานของมันได้ ขอชื่นชมผู้เขียน! แม้ว่าคุณจะใช้งานได้ฟรี แต่โปรดจำไว้ว่าการเผยแพร่โค้ดซ้ำจะต้องเป็นไปตาม กฎระเบียบการใช้งาน ของเรา
คำจำกัดสิทธิ์ความรับผิดชอบ
ข้อมูลและบทความไม่ได้มีวัตถุประสงค์เพื่อก่อให้เกิดกิจกรรมทางการเงิน, การลงทุน, การซื้อขาย, ข้อเสนอแนะ หรือคำแนะนำประเภทอื่น ๆ ที่ให้หรือรับรองโดย TradingView อ่านเพิ่มเติมใน ข้อกำหนดการใช้งาน