PINE LIBRARY
ที่อัปเดต: CommonMarkup
Library "CommonMarkup"
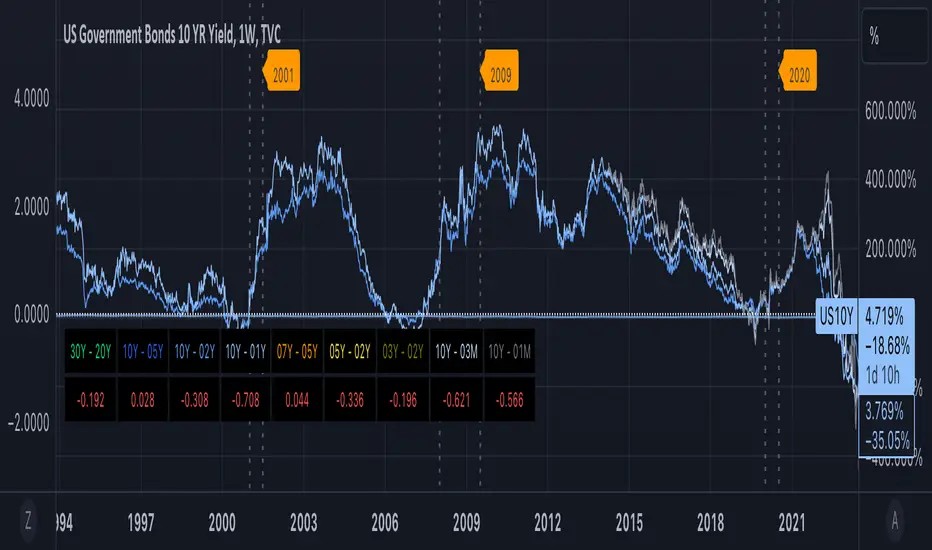
Provides functions for chart markup, such as indicating recession bands.
markRecessionBands(showBands, lineY, labelY)
Mark vertical bands and show recession band labels if argument showBands is true. Example "markRecessionBands(bar_index[0],3.0"
Parameters:
showBands: - show vertical recession bands when true. Functionally equiv to no op when false
lineY: - y-axis value for line positioning
labelY: - y-axis value for label positioning
return true - always answers the value of showBands
เอกสารเผยแพร่
Common markup lib v2. Changes as follows:- Added 2022 contraction over Q1 to Q2
- Updated time refs to be UTC+0
เอกสารเผยแพร่
Minor cosmetic rendering updatesเอกสารเผยแพร่
v4 - minor display and formatting updates for readabilityเอกสารเผยแพร่
v5Added control parameter for defining if 2 consecutive quarters of negative GDP is considered a recession
Updated:
markRecessionBands(showBands, twoQrtsOfNegativeGDPIsRecession, lineY, labelY)
Mark vertical bands and show recession band labels if argument showBands is true. Example "markRecessionBands(bar_index[0],3.0"
Parameters:
showBands: - show vertical recession bands when true. Functionally equiv to no op when false
twoQrtsOfNegativeGDPIsRecession: - if true, then periods with two consecutive quarters of negative GDP is considered a recession. Defaut is false.
lineY: - y-axis value for line positioning
labelY: - y-axis value for label positioning
return true - always answers the value of showBands
เอกสารเผยแพร่
v6Updated:
markRecessionBands(showBands, twoQrtsOfNegativeGDPIsRecession, labelY)
Mark vertical bands and show recession band labels if argument showBands is true. Example "markRecessionBands(bar_index[0],false3.0)"
Parameters:
showBands (bool): - show vertical recession bands when true. Functionally equiv to no op when false
twoQrtsOfNegativeGDPIsRecession (bool): - if true, then periods with two consecutive quarters of negative GDP are considered a recession. Defaut is false.
labelY (float): - y-axis value for label positioning
return true - always answers the value of showBands
เอกสารเผยแพร่
v7Updated:
- Resolved issue with private function for drawing recession bands scaling the y-axis excessively
ไลบรารีไพน์
ด้วยเจตนารมณ์หลักของ TradingView ผู้เขียนได้เผยแพร่ Pine code นี้เป็นโอเพนซอร์สไลบรารีเพื่อให้ Pine โปรแกรมเมอร์คนอื่นในชุมชนของเราสามารถนำไปใช้ซ้ำได้ ต้องขอบคุณผู้เขียน! คุณสามารถใช้ไลบรารีนี้ในแบบส่วนตัวหรือในการเผยแพร่แบบโอเพนซอร์สอื่น ๆ แต่การนำโค้ดนี้ไปใช้ในการเผยแพร่ซ้ำจะต้องอยู่ภายใต้ กฎระเบียบการใช้งาน
คำจำกัดสิทธิ์ความรับผิดชอบ
ข้อมูลและบทความไม่ได้มีวัตถุประสงค์เพื่อก่อให้เกิดกิจกรรมทางการเงิน, การลงทุน, การซื้อขาย, ข้อเสนอแนะ หรือคำแนะนำประเภทอื่น ๆ ที่ให้หรือรับรองโดย TradingView อ่านเพิ่มเติมใน ข้อกำหนดการใช้งาน