OPEN-SOURCE SCRIPT
Analyse-Werte im Chart (Multi-Timeframe)
Core Components
The indicator evaluates a trend based on four main pillars, which are combined into an overall score:
Momentum (Rate of Change / Standard Deviation): Measures the strength and speed of the current price movement. High momentum indicates a strong, directional move.
Trend Stability (R² - R-Squared): This is the heart of the analysis. The indicator searches for the best-fitting linear regression line within a user-defined period. The R² value (0-100%) indicates how well the price action fits this straight line. A high value signals a very stable, "clean" trend.
Stability/Risk (Rate of Change / Ulcer Index): Compares the trend strength to the pullbacks (drawdowns) it has experienced. A trend that rises steadily without suffering deep declines receives a high rating here.
RSI Proximity to 60: A small bonus factor based on the assumption that strong uptrends often use the 60 RSI level as support.
## The Output Table
The result of this analysis is displayed in a clear table:
Score Value: An overall grade from 0 to 100 that provides a weighted summary of the four components mentioned above.
R2 Value (%): Indicates the percentage of "linearity" of the identified trend.
Regression Length: The number of candles over which the most stable trend was found.
Channel Z-Value: Measures how many standard deviations the current price is away from the trend line. A high positive value (> 1.8) can indicate an over-extended or "overheated" condition.
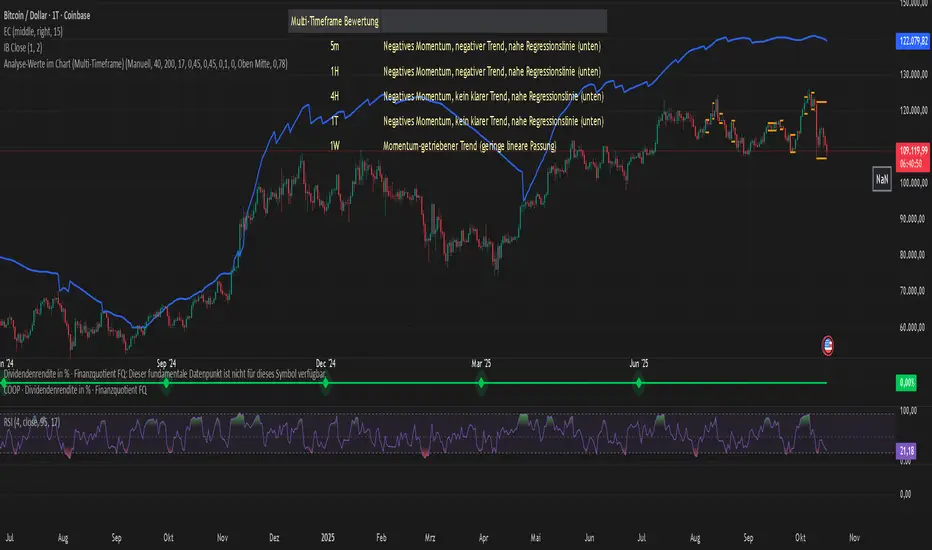
Evaluation: An auto-generated text that translates the mathematical values into a human-readable assessment. It distinguishes between stable trends, momentum-driven (unstable) trends, corrections, and sideways phases.
Multi-Timeframe Analysis: Shows the "Evaluation" for various timeframes (from 5 minutes to 1 week), allowing for a quick overview of the asset's overall picture.
## Flexibility through Profiles and Manual Control
One of the indicator's greatest strengths is its customizability:
Profiles: You can switch between three predefined analysis profiles with a single click:
Short-Term: Focuses on high momentum for day trading.
Mid-Term: A balanced setting for swing trading (Standard).
Long-Term: Focuses on the stability of the primary trend for investors.
Manual Mode: Allows you to adjust every single setting (R2 lengths, score weights) yourself to perfectly tailor the indicator to your own strategy and the specific chart.
The indicator evaluates a trend based on four main pillars, which are combined into an overall score:
Momentum (Rate of Change / Standard Deviation): Measures the strength and speed of the current price movement. High momentum indicates a strong, directional move.
Trend Stability (R² - R-Squared): This is the heart of the analysis. The indicator searches for the best-fitting linear regression line within a user-defined period. The R² value (0-100%) indicates how well the price action fits this straight line. A high value signals a very stable, "clean" trend.
Stability/Risk (Rate of Change / Ulcer Index): Compares the trend strength to the pullbacks (drawdowns) it has experienced. A trend that rises steadily without suffering deep declines receives a high rating here.
RSI Proximity to 60: A small bonus factor based on the assumption that strong uptrends often use the 60 RSI level as support.
## The Output Table
The result of this analysis is displayed in a clear table:
Score Value: An overall grade from 0 to 100 that provides a weighted summary of the four components mentioned above.
R2 Value (%): Indicates the percentage of "linearity" of the identified trend.
Regression Length: The number of candles over which the most stable trend was found.
Channel Z-Value: Measures how many standard deviations the current price is away from the trend line. A high positive value (> 1.8) can indicate an over-extended or "overheated" condition.
Evaluation: An auto-generated text that translates the mathematical values into a human-readable assessment. It distinguishes between stable trends, momentum-driven (unstable) trends, corrections, and sideways phases.
Multi-Timeframe Analysis: Shows the "Evaluation" for various timeframes (from 5 minutes to 1 week), allowing for a quick overview of the asset's overall picture.
## Flexibility through Profiles and Manual Control
One of the indicator's greatest strengths is its customizability:
Profiles: You can switch between three predefined analysis profiles with a single click:
Short-Term: Focuses on high momentum for day trading.
Mid-Term: A balanced setting for swing trading (Standard).
Long-Term: Focuses on the stability of the primary trend for investors.
Manual Mode: Allows you to adjust every single setting (R2 lengths, score weights) yourself to perfectly tailor the indicator to your own strategy and the specific chart.
สคริปต์โอเพนซอร์ซ
ด้วยเจตนารมณ์หลักของ TradingView ผู้สร้างสคริปต์นี้ได้ทำให้เป็นโอเพนซอร์ส เพื่อให้เทรดเดอร์สามารถตรวจสอบและยืนยันฟังก์ชันการทำงานของมันได้ ขอชื่นชมผู้เขียน! แม้ว่าคุณจะใช้งานได้ฟรี แต่โปรดจำไว้ว่าการเผยแพร่โค้ดซ้ำจะต้องเป็นไปตาม กฎระเบียบการใช้งาน ของเรา
คำจำกัดสิทธิ์ความรับผิดชอบ
ข้อมูลและบทความไม่ได้มีวัตถุประสงค์เพื่อก่อให้เกิดกิจกรรมทางการเงิน, การลงทุน, การซื้อขาย, ข้อเสนอแนะ หรือคำแนะนำประเภทอื่น ๆ ที่ให้หรือรับรองโดย TradingView อ่านเพิ่มเติมใน ข้อกำหนดการใช้งาน