OPEN-SOURCE SCRIPT
ที่อัปเดต: Buyer vs Seller Control
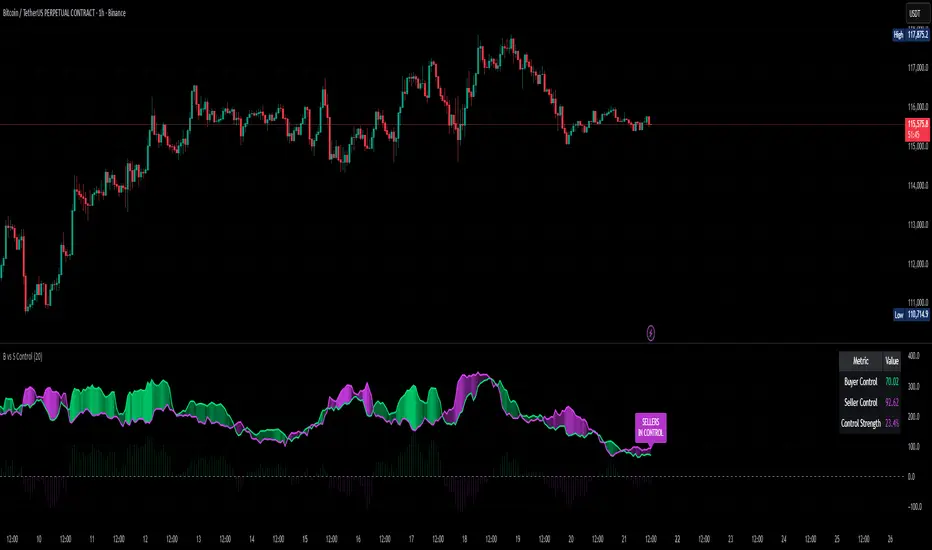
BUYER vs SELLER CONTROL INDICATOR
Identify market dominance and potential trend shifts with wick analysis
What This Indicator Measures:
This indicator analyzes who controls the market by measuring the battle between buyers and sellers on each candle:
What's Plotted:
How to Read the Signals:
Trading Applications:
Key Features:
Pro Tip: Use this with your favorite trend or momentum indicators for confluence. Strong buyer/seller control often precedes significant price moves!
Pine Script®
Identify market dominance and potential trend shifts with wick analysis
What This Indicator Measures:
This indicator analyzes who controls the market by measuring the battle between buyers and sellers on each candle:
- Buyer Control: How far the closing price is above the candle's low (bottom wick strength)
- Seller Control: How far the closing price is below the candle's high (top wick strength)
What's Plotted:
- Lime Line: 20-period moving average of buyer control
- Fuchsia Line: 20-period moving average of seller control
- Dynamic Fill: Area between lines - color shows who's winning
- Histogram: Shows the difference between buyer and seller control
- Control Label: Text showing current market dominance
- Info Table: Real-time values and control strength percentage
How to Read the Signals:
🟢 LIME FILL = BUYERS IN CONTROL
When the lime line is above fuchsia, buyers are dominating. The brighter the fill, the stronger their control.
🔴 FUCHSIA FILL = SELLERS IN CONTROL
When the fuchsia line is above lime, sellers are dominating. The brighter the fill, the stronger their control.
Trading Applications:
- Trend Confirmation: Strong buyer control confirms uptrends, strong seller control confirms downtrends
- Reversal Signals: Watch for control shifts - when lines cross, momentum may be changing
- Entry Timing: Enter long when buyer control strengthens, short when seller control strengthens
- Market Structure: Persistent control by one side suggests strong directional bias
Key Features:
- Works on any timeframe
- Customizable moving average period (default: 20)
- Optional info table display
- Dynamic transparency shows control strength
- Clean visual design for both dark and light themes
Pro Tip: Use this with your favorite trend or momentum indicators for confluence. Strong buyer/seller control often precedes significant price moves!
// Based on wick analysis and moving averages
// Green = Buyers dominating market
// Red = Sellers dominating market
// Fill intensity = Control strength
เอกสารเผยแพร่
- Fix label cumulation bug
เอกสารเผยแพร่
- Support Volume Based Chart Display
สคริปต์โอเพนซอร์ซ
ด้วยเจตนารมณ์หลักของ TradingView ผู้สร้างสคริปต์นี้ได้ทำให้มันเป็นโอเพ่นซอร์ส เพื่อให้เทรดเดอร์สามารถตรวจสอบและยืนยันการทำงานของสคริปต์ได้ ขอแสดงความชื่นชมผู้เขียน! แม้ว่าคุณจะสามารถใช้งานได้ฟรี แต่อย่าลืมว่าการเผยแพร่โค้ดซ้ำนั้นจะต้องเป็นไปตามกฎระเบียบการใช้งานของเรา
Get access to our indicators at: huntergatherers.tech
คำจำกัดสิทธิ์ความรับผิดชอบ
ข้อมูลและบทความไม่ได้มีวัตถุประสงค์เพื่อก่อให้เกิดกิจกรรมทางการเงิน, การลงทุน, การซื้อขาย, ข้อเสนอแนะ หรือคำแนะนำประเภทอื่น ๆ ที่ให้หรือรับรองโดย TradingView อ่านเพิ่มเติมที่ ข้อกำหนดการใช้งาน