PROTECTED SOURCE SCRIPT
Universally Applicable Valuation Indicator
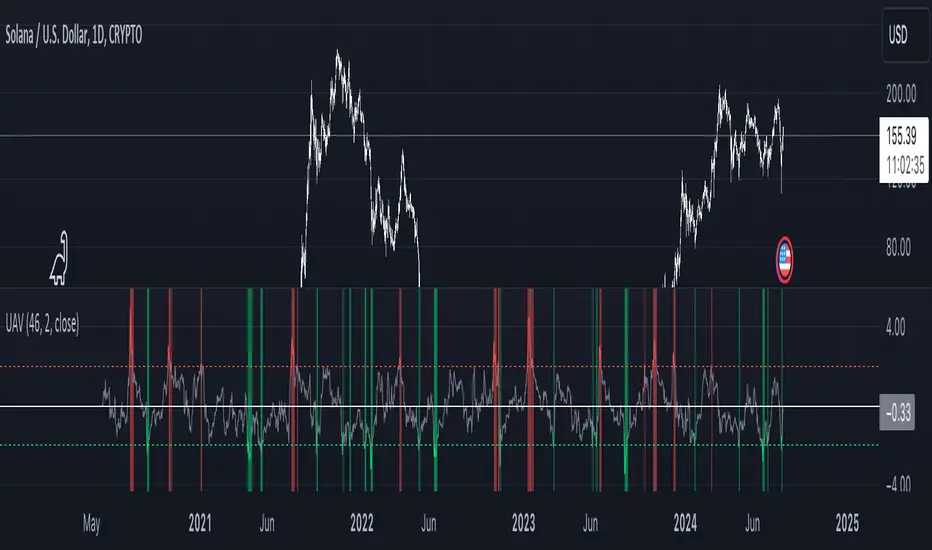
The UAV indicator utilizes a z-score analysis of the Relative Strength Index (RSI) to offer insights into current market conditions.
By comparing the current z-score to its historical distribution, the indicator generates signals that highlight potential overbought or oversold areas.
It features clear visual cues, with color changes occurring as the score crosses plotted standard deviation lines, making it easier to identify potential entry and exit points across all assets and timeframes.
สคริปต์ที่ได้รับการป้องกัน
สคริปต์นี้ถูกเผยแพร่เป็นแบบ closed-source อย่างไรก็ตาม คุณสามารถใช้ได้อย่างอิสระและไม่มีข้อจำกัดใดๆ – เรียนรู้เพิ่มเติมได้ที่นี่
คำจำกัดสิทธิ์ความรับผิดชอบ
ข้อมูลและบทความไม่ได้มีวัตถุประสงค์เพื่อก่อให้เกิดกิจกรรมทางการเงิน, การลงทุน, การซื้อขาย, ข้อเสนอแนะ หรือคำแนะนำประเภทอื่น ๆ ที่ให้หรือรับรองโดย TradingView อ่านเพิ่มเติมใน ข้อกำหนดการใช้งาน