OPEN-SOURCE SCRIPT
Percent difference from 50 & 200 day MAs
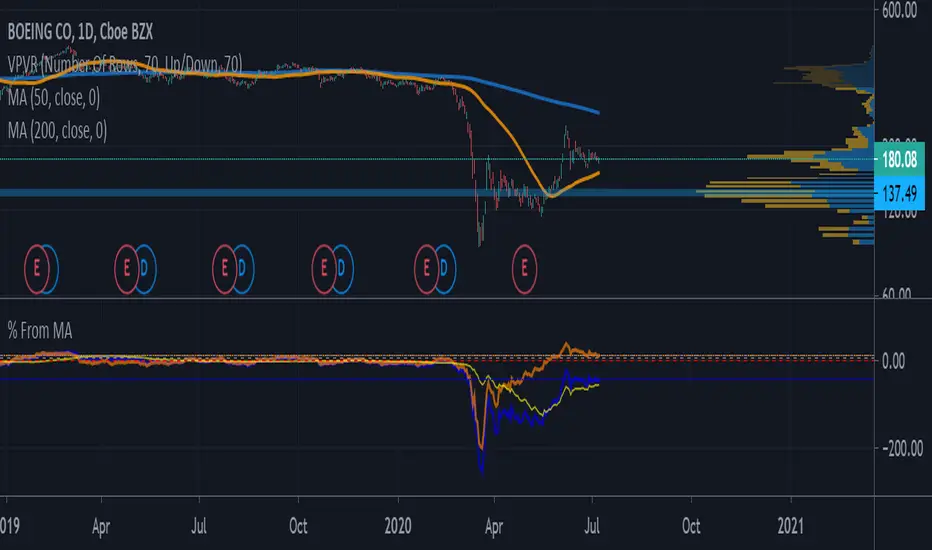
To chart price relative to 50 and 200 day SMAs and to use the difference between those metrics as an indicator of bull or bear market and potential turnarounds.
สคริปต์โอเพนซอร์ซ
ด้วยเจตนารมณ์หลักของ TradingView ผู้สร้างสคริปต์นี้ได้ทำให้เป็นโอเพนซอร์ส เพื่อให้เทรดเดอร์สามารถตรวจสอบและยืนยันฟังก์ชันการทำงานของมันได้ ขอชื่นชมผู้เขียน! แม้ว่าคุณจะใช้งานได้ฟรี แต่โปรดจำไว้ว่าการเผยแพร่โค้ดซ้ำจะต้องเป็นไปตาม กฎระเบียบการใช้งาน ของเรา
คำจำกัดสิทธิ์ความรับผิดชอบ
ข้อมูลและบทความไม่ได้มีวัตถุประสงค์เพื่อก่อให้เกิดกิจกรรมทางการเงิน, การลงทุน, การซื้อขาย, ข้อเสนอแนะ หรือคำแนะนำประเภทอื่น ๆ ที่ให้หรือรับรองโดย TradingView อ่านเพิ่มเติมใน ข้อกำหนดการใช้งาน