OPEN-SOURCE SCRIPT
KT HMA
Overview :
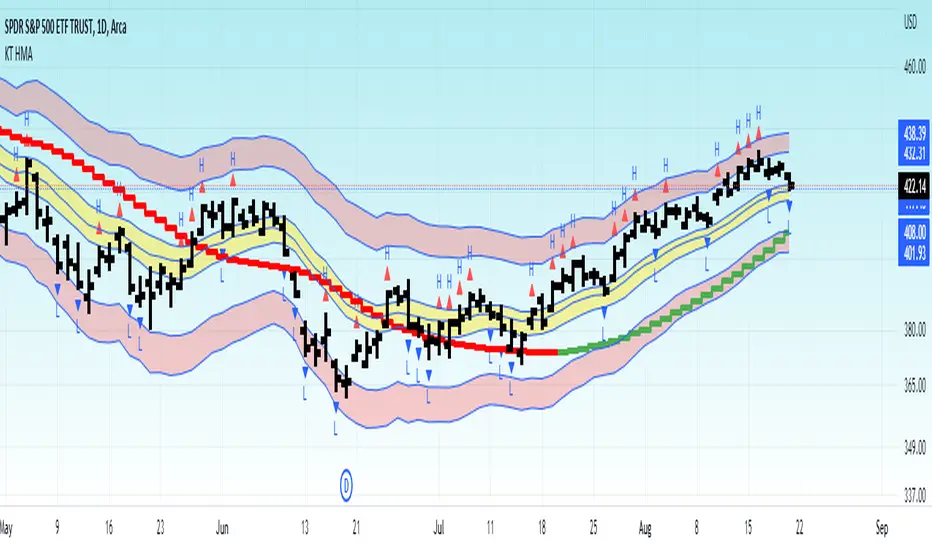
This indicator is an experiment to combine one of the volatility concepts (ATR), weighted MA and price movements to help visualize current market condition.
Red Band : ATR volatility bands with 2nd and 3rd standard deviation.
Yellow Band : Moving Average band
HMA : Green/Red >> Shows current trend. Using HMA to emphasize on recent price points rather than older one.
-----------------
Disclaimer
My Scripts/Indicators/Ideas/Systems including above ones are only for educational purposes. The information contained in the Scripts/Indicators/Ideas does not constitute financial advice or a solicitation to buy or sell any securities of any type. All investments involve risk, and the past performance of a security, industry, sector, market, financial product, trading strategy, backtest, or individual's trading does not guarantee future results or returns. Do not trade with capital that you can not afford to lose. Investors are fully responsible for any investment decisions they make. Such decisions should be based solely on an evaluation of their financial circumstances, investment objectives, risk tolerance, and liquidity needs.
สคริปต์โอเพนซอร์ซ
ด้วยเจตนารมณ์หลักของ TradingView ผู้สร้างสคริปต์นี้ได้ทำให้เป็นโอเพนซอร์ส เพื่อให้เทรดเดอร์สามารถตรวจสอบและยืนยันฟังก์ชันการทำงานของมันได้ ขอชื่นชมผู้เขียน! แม้ว่าคุณจะใช้งานได้ฟรี แต่โปรดจำไว้ว่าการเผยแพร่โค้ดซ้ำจะต้องเป็นไปตาม กฎระเบียบการใช้งาน ของเรา
คำจำกัดสิทธิ์ความรับผิดชอบ
ข้อมูลและบทความไม่ได้มีวัตถุประสงค์เพื่อก่อให้เกิดกิจกรรมทางการเงิน, การลงทุน, การซื้อขาย, ข้อเสนอแนะ หรือคำแนะนำประเภทอื่น ๆ ที่ให้หรือรับรองโดย TradingView อ่านเพิ่มเติมใน ข้อกำหนดการใช้งาน