PROTECTED SOURCE SCRIPT
ที่อัปเดต: Structural S/D (Nephew_Sam_)

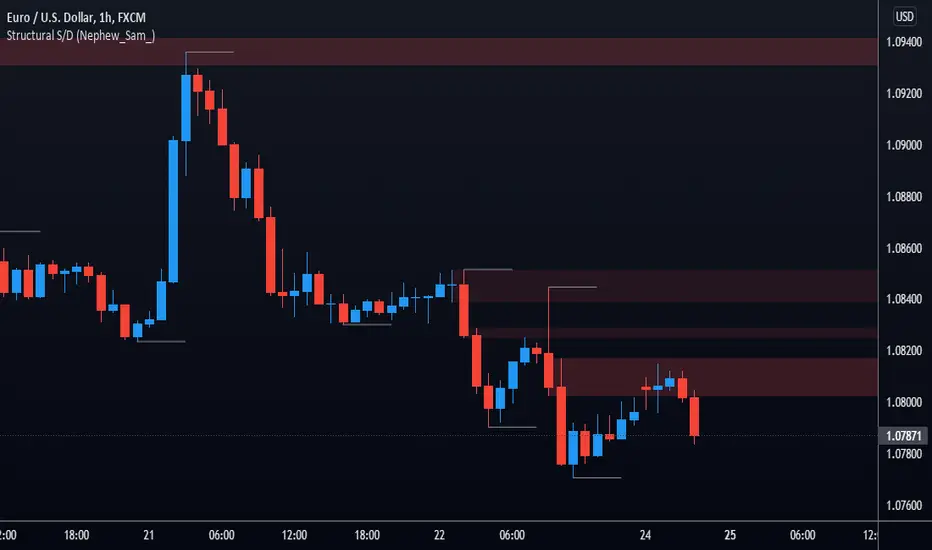
This is a supply and demand indicator based on structural pivot points.
Everytime a pivot high/low is broken, it will plot the recent wicks of the candle that caused the break of pivot stucture and the one before it.
This is know as a 'stall' before an explosive move.
Indicator Settings:
Filled type - is zone filled once price closes away from it or if wick fills it
Delete filled - delete boxes once price has filled it
Pivots - similar to fractal points, each pivot is the highest/lowest point in a group of x left and x right bars
Box visuals - extend, colors, style etc
เอกสารเผยแพร่
Bug fix + chart markupเอกสารเผยแพร่
Bear boxes bug fixสคริปต์ที่ได้รับการป้องกัน
สคริปต์นี้ถูกเผยแพร่เป็นแบบ closed-source อย่างไรก็ตาม คุณสามารถใช้ได้อย่างอิสระและไม่มีข้อจำกัดใดๆ – เรียนรู้เพิ่มเติมได้ที่นี่
คำจำกัดสิทธิ์ความรับผิดชอบ
ข้อมูลและบทความไม่ได้มีวัตถุประสงค์เพื่อก่อให้เกิดกิจกรรมทางการเงิน, การลงทุน, การซื้อขาย, ข้อเสนอแนะ หรือคำแนะนำประเภทอื่น ๆ ที่ให้หรือรับรองโดย TradingView อ่านเพิ่มเติมใน ข้อกำหนดการใช้งาน
สคริปต์ที่ได้รับการป้องกัน
สคริปต์นี้ถูกเผยแพร่เป็นแบบ closed-source อย่างไรก็ตาม คุณสามารถใช้ได้อย่างอิสระและไม่มีข้อจำกัดใดๆ – เรียนรู้เพิ่มเติมได้ที่นี่
คำจำกัดสิทธิ์ความรับผิดชอบ
ข้อมูลและบทความไม่ได้มีวัตถุประสงค์เพื่อก่อให้เกิดกิจกรรมทางการเงิน, การลงทุน, การซื้อขาย, ข้อเสนอแนะ หรือคำแนะนำประเภทอื่น ๆ ที่ให้หรือรับรองโดย TradingView อ่านเพิ่มเติมใน ข้อกำหนดการใช้งาน