OPEN-SOURCE SCRIPT
ที่อัปเดต: Elgrand - Overbought/sold Rsi + Stochastic zones
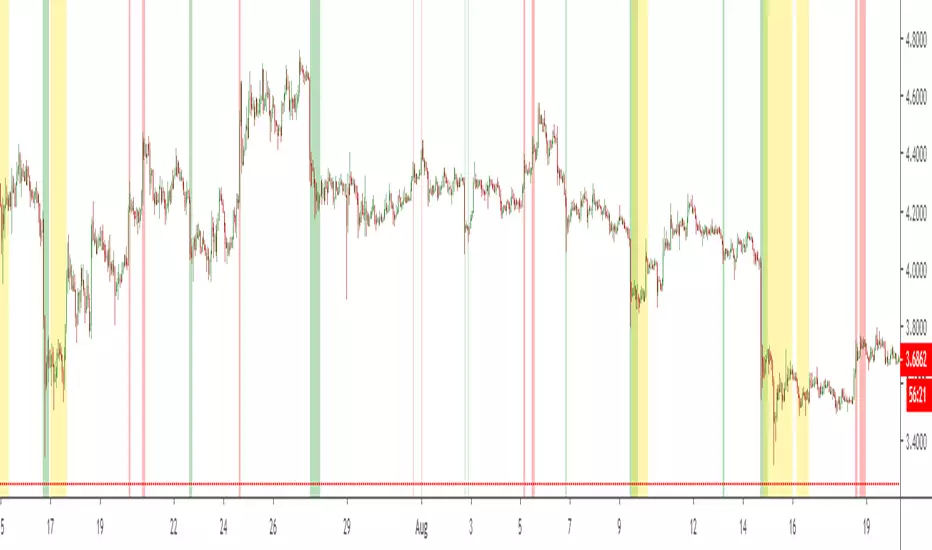
Visualize on your chart when price in an oversold or overbought zone. A combination of Rsi and Stochasticrsi is used for higher probability. Wait for an zone to be displayed and then wait for price to exit a zone. Once this happens check candlestick patterns and support/resistance "lines" to find appropiate stoplosses for you entry or exit
เอกสารเผยแพร่
Update :- Upgraded to use version 4 of Pinescript
Added and extra timeframe which will show in yellow on your chart : this way you can decide to enter exit if 1H overbought/oversold is also happening on the 4H timeframe. Idea is that this will lower your entry/exit risk.
Todo :
- Make the parent timeframe display optional
Be able to choose per timeframe which parent timeframe you would like to use
สคริปต์โอเพนซอร์ซ
ด้วยเจตนารมณ์หลักของ TradingView ผู้สร้างสคริปต์นี้ได้ทำให้เป็นโอเพนซอร์ส เพื่อให้เทรดเดอร์สามารถตรวจสอบและยืนยันฟังก์ชันการทำงานของมันได้ ขอชื่นชมผู้เขียน! แม้ว่าคุณจะใช้งานได้ฟรี แต่โปรดจำไว้ว่าการเผยแพร่โค้ดซ้ำจะต้องเป็นไปตาม กฎระเบียบการใช้งาน ของเรา
คำจำกัดสิทธิ์ความรับผิดชอบ
ข้อมูลและบทความไม่ได้มีวัตถุประสงค์เพื่อก่อให้เกิดกิจกรรมทางการเงิน, การลงทุน, การซื้อขาย, ข้อเสนอแนะ หรือคำแนะนำประเภทอื่น ๆ ที่ให้หรือรับรองโดย TradingView อ่านเพิ่มเติมใน ข้อกำหนดการใช้งาน