OPEN-SOURCE SCRIPT
ที่อัปเดต: Compare TOTAL, TOTAL2, TOTAL3, and OTHERS
Compare TOTAL, TOTAL2, TOTAL3, and OTHERS
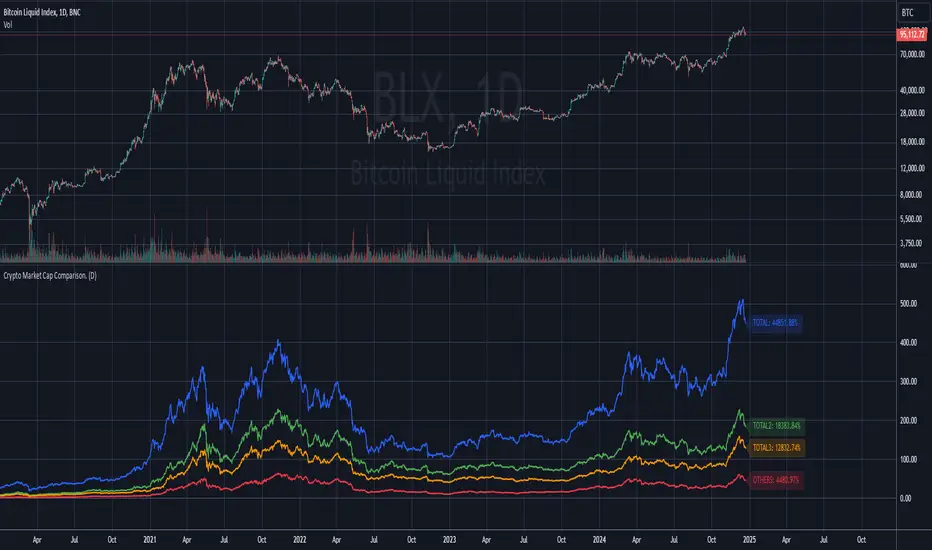
This indicator compares the performance of major cryptocurrency market cap indices: TOTAL, TOTAL2, TOTAL3, and OTHERS. It normalizes each index's performance relative to its starting value and visualizes their relative changes over time.
Features
- Normalized Performance: Tracks the percentage change of each index from its initial value.
- Customizable Timeframe: Allows users to select a base timeframe for the data (e.g., daily, weekly).
- Dynamic Labels: Displays the latest performance of each index as a label on the chart, aligned to the right of the corresponding line for easy comparison.
- Color-Coded Lines: Each index is assigned a distinct color for clear differentiation:
-- TOTAL (Blue): Represents the total cryptocurrency market cap.
-- TOTAL2 (Green): Excludes Bitcoin.
-- TOTAL3 (Orange): Excludes Bitcoin and Ethereum.
-- OTHERS (Red): Represents all cryptocurrencies excluding the top 10 by market cap.
- Baseline Reference: Includes a horizontal line at 0% for reference.
Use Cases:
- Market Trends: Identify which segments of the cryptocurrency market are outperforming or underperforming over time.
- Portfolio Insights: Assess the impact of Bitcoin and Ethereum dominance on the broader market.
- Market Analysis: Compare smaller-cap coins (OTHERS) with broader indices (TOTAL, TOTAL2, and TOTAL3).
This script is ideal for traders and analysts who want a quick, visual way to track how different segments of the cryptocurrency market perform relative to each other over time.
Note: The performance is normalized to highlight percentage changes, not absolute values.
เอกสารเผยแพร่
screenshot updatedสคริปต์โอเพนซอร์ซ
ด้วยเจตนารมณ์หลักของ TradingView ผู้สร้างสคริปต์นี้ได้ทำให้เป็นโอเพนซอร์ส เพื่อให้เทรดเดอร์สามารถตรวจสอบและยืนยันฟังก์ชันการทำงานของมันได้ ขอชื่นชมผู้เขียน! แม้ว่าคุณจะใช้งานได้ฟรี แต่โปรดจำไว้ว่าการเผยแพร่โค้ดซ้ำจะต้องเป็นไปตาม กฎระเบียบการใช้งาน ของเรา
คำจำกัดสิทธิ์ความรับผิดชอบ
ข้อมูลและบทความไม่ได้มีวัตถุประสงค์เพื่อก่อให้เกิดกิจกรรมทางการเงิน, การลงทุน, การซื้อขาย, ข้อเสนอแนะ หรือคำแนะนำประเภทอื่น ๆ ที่ให้หรือรับรองโดย TradingView อ่านเพิ่มเติมใน ข้อกำหนดการใช้งาน
สคริปต์โอเพนซอร์ซ
ด้วยเจตนารมณ์หลักของ TradingView ผู้สร้างสคริปต์นี้ได้ทำให้เป็นโอเพนซอร์ส เพื่อให้เทรดเดอร์สามารถตรวจสอบและยืนยันฟังก์ชันการทำงานของมันได้ ขอชื่นชมผู้เขียน! แม้ว่าคุณจะใช้งานได้ฟรี แต่โปรดจำไว้ว่าการเผยแพร่โค้ดซ้ำจะต้องเป็นไปตาม กฎระเบียบการใช้งาน ของเรา
คำจำกัดสิทธิ์ความรับผิดชอบ
ข้อมูลและบทความไม่ได้มีวัตถุประสงค์เพื่อก่อให้เกิดกิจกรรมทางการเงิน, การลงทุน, การซื้อขาย, ข้อเสนอแนะ หรือคำแนะนำประเภทอื่น ๆ ที่ให้หรือรับรองโดย TradingView อ่านเพิ่มเติมใน ข้อกำหนดการใช้งาน