OPEN-SOURCE SCRIPT
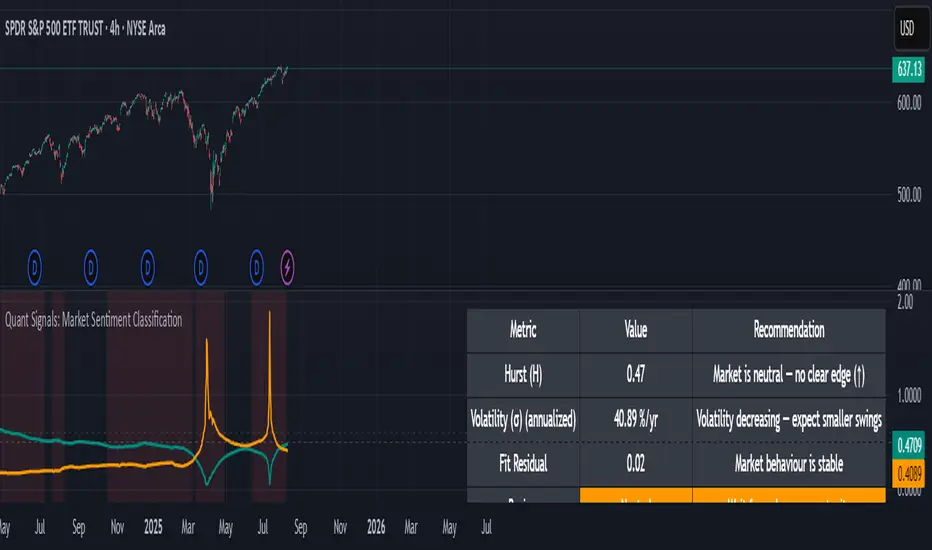
Quant Signals: Market Sentiment Monitor HUD
Wavelets & Scale Spectrum
This indicator is ideal for traders who adapt their strategy to market conditions — such as swing traders, intraday traders, and system developers.
Wavelets are like tiny “measuring rulers” for price changes. Instead of looking at the whole chart at once, a wavelet looks at differences in price over a specific time scale — for example, 2 bars, 4 bars, 8 bars, and so on.
The scale spectrum is what you get when you measure volatility at several of these scales and then plot them against scale size.
This approach works like a microscope, revealing whether the market’s behaviour is consistent across short-term and long-term horizons, and when that behaviour changes.
This tool applies a wavelet-based scale-spectrum analysis to price data to estimate three key market state measures inside a rolling window:
Hurst exponent (H) — measures persistence in price moves:
Volatility (σ) — the average size of price swings at your chart’s timeframe, optionally annualized. Rising volatility means larger price moves, falling volatility means smaller moves.
Fit residual — how well the observed multi-scale volatility fits a clean power-law line. Low residual = stable behaviour; high residual = structural change (possible regime shift).
This indicator is ideal for traders who adapt their strategy to market conditions — such as swing traders, intraday traders, and system developers.
- Trend-followers can use it to confirm trending conditions before entering.
- Mean-reversion traders can spot choppy markets where reversals are more likely.
- Risk managers can monitor volatility shifts and regime changes to adjust position size or pause trading.
It works best as a market context filter — telling you the “weather” before you decide on the trade.
Wavelets are like tiny “measuring rulers” for price changes. Instead of looking at the whole chart at once, a wavelet looks at differences in price over a specific time scale — for example, 2 bars, 4 bars, 8 bars, and so on.
The scale spectrum is what you get when you measure volatility at several of these scales and then plot them against scale size.
- If the spectrum forms a straight line on a log–log chart, it means price changes follow a consistent pattern across time scales (a power-law relationship).
- The slope of that line gives the Hurst exponent (H) — telling you whether moves tend to persist (trend) or reverse (mean-revert).
- The height of the line gives you the volatility (σ) — the average size of moves.
This approach works like a microscope, revealing whether the market’s behaviour is consistent across short-term and long-term horizons, and when that behaviour changes.
This tool applies a wavelet-based scale-spectrum analysis to price data to estimate three key market state measures inside a rolling window:
Hurst exponent (H) — measures persistence in price moves:
- H > ~0.55 → market is trending (moves tend to continue).
- H < ~0.45 → market is choppy/mean-reverting (moves tend to reverse).
- Values near 0.5 indicate a neutral, random-walk-like regime.
Volatility (σ) — the average size of price swings at your chart’s timeframe, optionally annualized. Rising volatility means larger price moves, falling volatility means smaller moves.
Fit residual — how well the observed multi-scale volatility fits a clean power-law line. Low residual = stable behaviour; high residual = structural change (possible regime shift).
สคริปต์โอเพนซอร์ซ
ด้วยเจตนารมณ์หลักของ TradingView ผู้สร้างสคริปต์นี้ได้ทำให้เป็นโอเพนซอร์ส เพื่อให้เทรดเดอร์สามารถตรวจสอบและยืนยันฟังก์ชันการทำงานของมันได้ ขอชื่นชมผู้เขียน! แม้ว่าคุณจะใช้งานได้ฟรี แต่โปรดจำไว้ว่าการเผยแพร่โค้ดซ้ำจะต้องเป็นไปตาม กฎระเบียบการใช้งาน ของเรา
คำจำกัดสิทธิ์ความรับผิดชอบ
ข้อมูลและบทความไม่ได้มีวัตถุประสงค์เพื่อก่อให้เกิดกิจกรรมทางการเงิน, การลงทุน, การซื้อขาย, ข้อเสนอแนะ หรือคำแนะนำประเภทอื่น ๆ ที่ให้หรือรับรองโดย TradingView อ่านเพิ่มเติมใน ข้อกำหนดการใช้งาน