QuantPivote
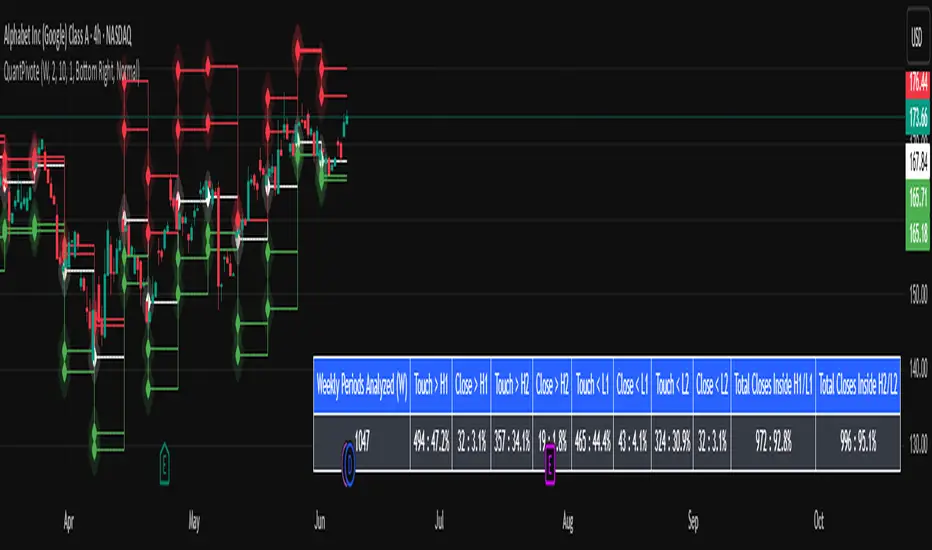
Weekly Periods Analyzed :
- The number of total periods loaded and analyzed is on the chart.
Touch > H1 :
- Pivot level average price exceeded or was equal to, but did not close above.
Close > H1 :
- How often has the price closed above the H1 pivot level.
Touch > H2 :
- Pivot level one standard deviation above H1.
- The price exceeded or was equal to, but did not close above.
Close > H2 :
- How many times has the price closed above the H2 pivot level .
Touch > L1 :
- Pivot level average price exceeded or was equal to, but did not close below.
Close > L1 :
- How many times has the price closed below the L1 pivot level.
Touch > L2 :
- Pivot level one standard deviation below L1.
- The price exceeded or was equal to, but did not closed below.
Close > L2 :
- How many times has the price closed below the L2 pivot level.
Total Closes Inside H1 / L1 :
- Total number of times with in the periods analyzed that there were closes within H1 / L1 .
Total Closes Inside H2 / L2 :
- Total number of times with in the periods analyzed that there were closes within H2 / L2 respectively.
Pivots :
Pivot lines are a function of the analysis and averaging period inputs.
- H1 represents the average point which the highest price is achieved for the selected time period (analysis period).
- L1 represents the average point which the lowest price is achieved for the selected time period (analysis period).
- H2/L2 = One standard deviation away from the inner high H1 or low L1 bands.
สคริปต์แบบเฉพาะผู้ได้รับเชิญเท่านั้น
เฉพาะผู้ใช้งานที่ผู้เขียนอนุมัตเท่านั้นจึงจะสามารถเข้าถึงสคริปต์นี้ได้ คุณจะต้องขอและได้รับอนุญาตก่อนใช้งาน ซึ่งโดยทั่วไปจะได้รับอนุญาตหลังจากชำระเงินแล้ว สำหรับรายละเอียดเพิ่มเติม โปรดทำตามคำแนะนำของผู้เขียนด้านล่าง หรือติดต่อ pineaflAlgo โดยตรง
TradingView ไม่แนะนำให้จ่ายเงินหรือใช้สคริปต์ เว้นแต่คุณจะเชื่อถือผู้เขียนและเข้าใจวิธีการทำงานของสคริปต์นั้นอย่างถ่องแท้ คุณยังสามารถหาทางเลือกแบบโอเพนซอร์สฟรีได้ใน สคริปต์ชุมชนของเรา
คำแนะนำของผู้เขียน
คำจำกัดสิทธิ์ความรับผิดชอบ
สคริปต์แบบเฉพาะผู้ได้รับเชิญเท่านั้น
เฉพาะผู้ใช้งานที่ผู้เขียนอนุมัตเท่านั้นจึงจะสามารถเข้าถึงสคริปต์นี้ได้ คุณจะต้องขอและได้รับอนุญาตก่อนใช้งาน ซึ่งโดยทั่วไปจะได้รับอนุญาตหลังจากชำระเงินแล้ว สำหรับรายละเอียดเพิ่มเติม โปรดทำตามคำแนะนำของผู้เขียนด้านล่าง หรือติดต่อ pineaflAlgo โดยตรง
TradingView ไม่แนะนำให้จ่ายเงินหรือใช้สคริปต์ เว้นแต่คุณจะเชื่อถือผู้เขียนและเข้าใจวิธีการทำงานของสคริปต์นั้นอย่างถ่องแท้ คุณยังสามารถหาทางเลือกแบบโอเพนซอร์สฟรีได้ใน สคริปต์ชุมชนของเรา