OPEN-SOURCE SCRIPT
ที่อัปเดต: WaveMacBoll
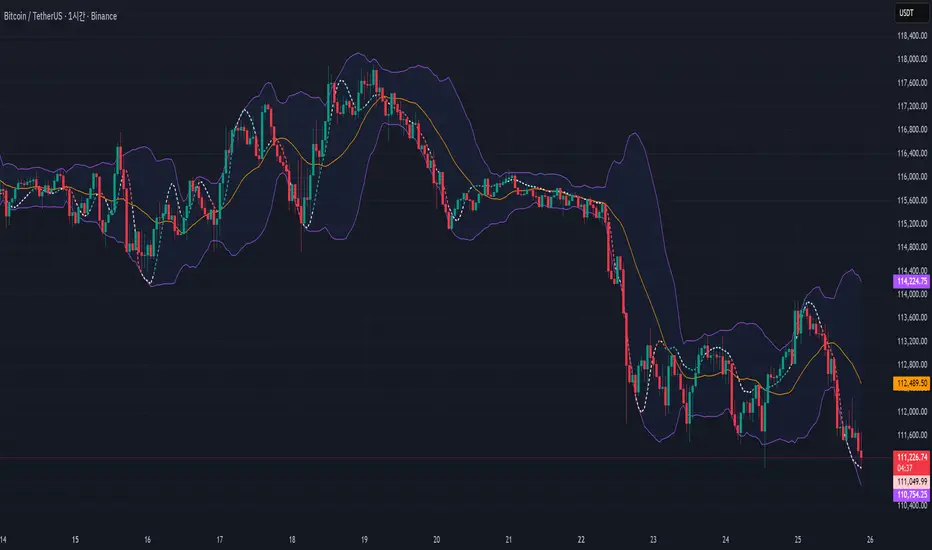
I wanted to see the two indicators in the candle chart, not in a separate window. And within the Bollinger band, it seemed to put it fine.
Important Note on Line Styles
Due to TradingView's multi-timeframe environment restrictions (timeframe = '', timeframe_gaps = true), I couldn't implement dotted or dashed line styles programmatically. The indicator uses solid lines by default.
If you prefer dotted/dashed lines for better visual distinction:
Add the indicator to your chart
Click on the indicator settings (gear icon)
Go to "Style" tab
Manually change line styles for each plot
Unfortunately, PineScript doesn't support line.new() or similar drawing functions in multi-timeframe mode, limiting our styling options to basic plot styles.
If you know a good solution for implementing dotted/dashed lines in multi-timeframe indicators without using drawing objects, please share it in the comments! I'd love to improve this aspect of the indicator
เอกสารเผยแพร่
.สคริปต์โอเพนซอร์ซ
ด้วยเจตนารมณ์หลักของ TradingView ผู้สร้างสคริปต์นี้ได้ทำให้เป็นโอเพนซอร์ส เพื่อให้เทรดเดอร์สามารถตรวจสอบและยืนยันฟังก์ชันการทำงานของมันได้ ขอชื่นชมผู้เขียน! แม้ว่าคุณจะใช้งานได้ฟรี แต่โปรดจำไว้ว่าการเผยแพร่โค้ดซ้ำจะต้องเป็นไปตาม กฎระเบียบการใช้งาน ของเรา
คำจำกัดสิทธิ์ความรับผิดชอบ
ข้อมูลและบทความไม่ได้มีวัตถุประสงค์เพื่อก่อให้เกิดกิจกรรมทางการเงิน, การลงทุน, การซื้อขาย, ข้อเสนอแนะ หรือคำแนะนำประเภทอื่น ๆ ที่ให้หรือรับรองโดย TradingView อ่านเพิ่มเติมใน ข้อกำหนดการใช้งาน
สคริปต์โอเพนซอร์ซ
ด้วยเจตนารมณ์หลักของ TradingView ผู้สร้างสคริปต์นี้ได้ทำให้เป็นโอเพนซอร์ส เพื่อให้เทรดเดอร์สามารถตรวจสอบและยืนยันฟังก์ชันการทำงานของมันได้ ขอชื่นชมผู้เขียน! แม้ว่าคุณจะใช้งานได้ฟรี แต่โปรดจำไว้ว่าการเผยแพร่โค้ดซ้ำจะต้องเป็นไปตาม กฎระเบียบการใช้งาน ของเรา
คำจำกัดสิทธิ์ความรับผิดชอบ
ข้อมูลและบทความไม่ได้มีวัตถุประสงค์เพื่อก่อให้เกิดกิจกรรมทางการเงิน, การลงทุน, การซื้อขาย, ข้อเสนอแนะ หรือคำแนะนำประเภทอื่น ๆ ที่ให้หรือรับรองโดย TradingView อ่านเพิ่มเติมใน ข้อกำหนดการใช้งาน