OPEN-SOURCE SCRIPT
ที่อัปเดต: Quant Signals: Econophysics-based Momentum
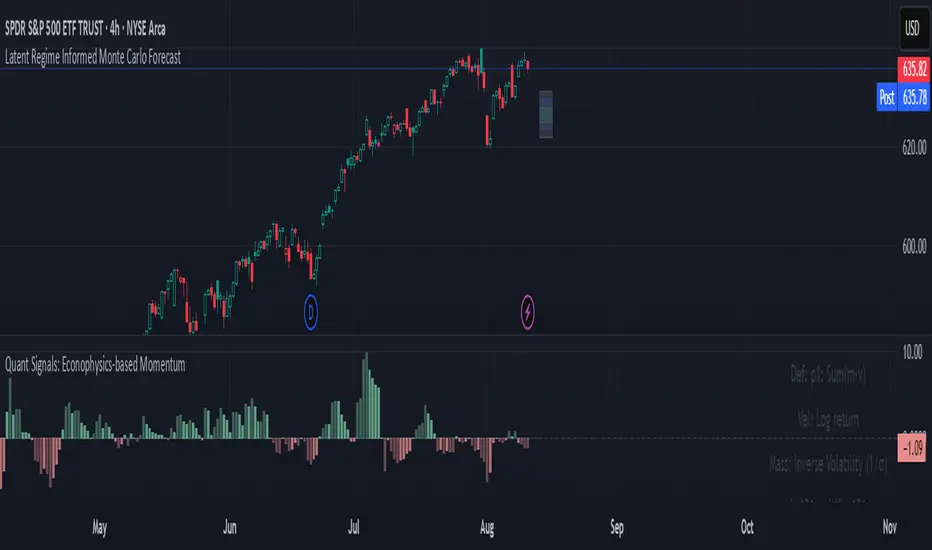
Physical Momentum Switcher (p0 / p1 / p2 / p3)
This indicator implements a “physical momentum” concept from quantitative finance research, where momentum is defined similarly to physics:
Momentum (p) = Mass × Velocity
Instead of using only the standard cumulative return (classic momentum), it lets you switch between multiple definitions:
Velocity can be measured as:
Mass (for p1/p2) can be defined as:
Features:
Typical uses:
Momentum trading: Buy when PM > 0 (or crosses above the signal), sell/short when PM < 0 (or crosses below).
Contrarian strategies: Reverse the logic when testing mean-reversion effects.
Cross-asset testing: Apply to different instruments to see which PM definition works best.
This indicator implements a “physical momentum” concept from quantitative finance research, where momentum is defined similarly to physics:
Momentum (p) = Mass × Velocity
Instead of using only the standard cumulative return (classic momentum), it lets you switch between multiple definitions:
- p0: Cumulative return over the lookback period (no mass, just price change).
- p1: Sum of (mass × velocity) over the lookback period.
- p2: Weighted average velocity = (Σ mass×velocity) ÷ (Σ mass).
- p3: Sharpe-like momentum = average velocity ÷ volatility (massless).
Velocity can be measured as:
- Log return: ln(Pt / Pt-1)
- Normal return: (Pt / Pt-1 – 1)
Mass (for p1/p2) can be defined as:
- Unit mass (1) — equal weighting, equivalent to traditional momentum.
- Turnover proxy — Volume ÷ average volume over k bars.
- Value turnover proxy — Dollar volume ÷ average dollar volume.
- Inverse volatility — 1 ÷ return volatility over a specified period.
Features:
- Switchable momentum definition, velocity type, and mass type.
- Adjustable lookback (k) and smoothing period for the signal line.
- Optional ±1σ display bands for quick overbought/oversold visual cues.
- Alerts for crosses above/below zero or the signal line.
- Table display summarizing current settings and values.
Typical uses:
Momentum trading: Buy when PM > 0 (or crosses above the signal), sell/short when PM < 0 (or crosses below).
Contrarian strategies: Reverse the logic when testing mean-reversion effects.
Cross-asset testing: Apply to different instruments to see which PM definition works best.
เอกสารเผยแพร่
Added histogram viewสคริปต์โอเพนซอร์ซ
ด้วยเจตนารมณ์หลักของ TradingView ผู้สร้างสคริปต์นี้ได้ทำให้เป็นโอเพนซอร์ส เพื่อให้เทรดเดอร์สามารถตรวจสอบและยืนยันฟังก์ชันการทำงานของมันได้ ขอชื่นชมผู้เขียน! แม้ว่าคุณจะใช้งานได้ฟรี แต่โปรดจำไว้ว่าการเผยแพร่โค้ดซ้ำจะต้องเป็นไปตาม กฎระเบียบการใช้งาน ของเรา
คำจำกัดสิทธิ์ความรับผิดชอบ
ข้อมูลและบทความไม่ได้มีวัตถุประสงค์เพื่อก่อให้เกิดกิจกรรมทางการเงิน, การลงทุน, การซื้อขาย, ข้อเสนอแนะ หรือคำแนะนำประเภทอื่น ๆ ที่ให้หรือรับรองโดย TradingView อ่านเพิ่มเติมใน ข้อกำหนดการใช้งาน
สคริปต์โอเพนซอร์ซ
ด้วยเจตนารมณ์หลักของ TradingView ผู้สร้างสคริปต์นี้ได้ทำให้เป็นโอเพนซอร์ส เพื่อให้เทรดเดอร์สามารถตรวจสอบและยืนยันฟังก์ชันการทำงานของมันได้ ขอชื่นชมผู้เขียน! แม้ว่าคุณจะใช้งานได้ฟรี แต่โปรดจำไว้ว่าการเผยแพร่โค้ดซ้ำจะต้องเป็นไปตาม กฎระเบียบการใช้งาน ของเรา
คำจำกัดสิทธิ์ความรับผิดชอบ
ข้อมูลและบทความไม่ได้มีวัตถุประสงค์เพื่อก่อให้เกิดกิจกรรมทางการเงิน, การลงทุน, การซื้อขาย, ข้อเสนอแนะ หรือคำแนะนำประเภทอื่น ๆ ที่ให้หรือรับรองโดย TradingView อ่านเพิ่มเติมใน ข้อกำหนดการใช้งาน