OPEN-SOURCE SCRIPT
ที่อัปเดต: Market Info Bar Charts - Was Bored
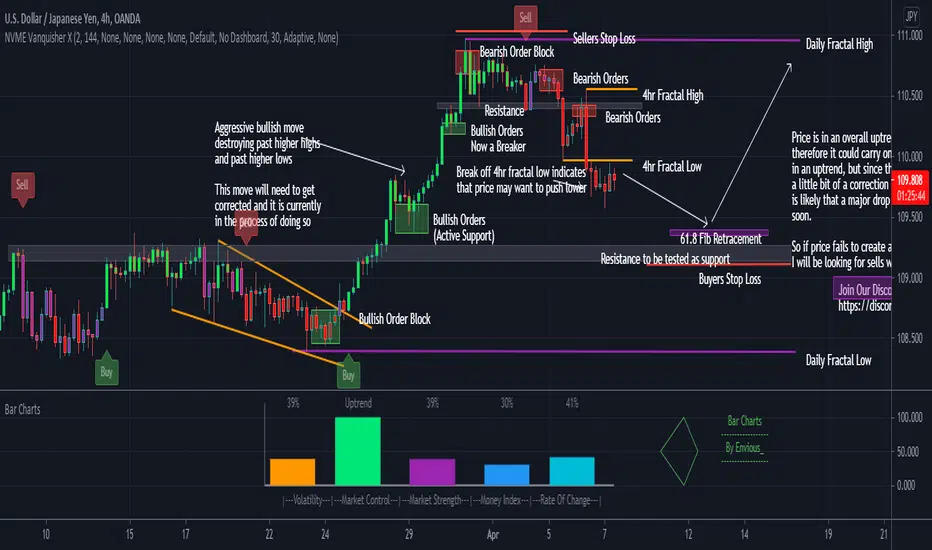
Simple script in a form of a bar chart showing you some market information ;)
เอกสารเผยแพร่
Added Information:Volatility is calculated using the relative volatility index
Market Control is calculated using exponential moving averages and the percent of the strength is based on how many bars the market goes on in that trend.
Market Strength is calculated with RSI and will change colour if it is overbought (red) or oversold (green)
Money Index is calculated with Money Flow Index
Rate of Change is calculated with ROC but it cannot go to a negative number and the max it can go up to is a 100%.
You can change anything in this market info bar chart indicator if you need :)
เอกสารเผยแพร่
Changed the font-size so that it suits the bar charts on different time-frames (still isn't fully accurate due to the limitation of font-sizes on pinescript)สคริปต์โอเพนซอร์ซ
ด้วยเจตนารมณ์หลักของ TradingView ผู้สร้างสคริปต์นี้ได้ทำให้เป็นโอเพนซอร์ส เพื่อให้เทรดเดอร์สามารถตรวจสอบและยืนยันฟังก์ชันการทำงานของมันได้ ขอชื่นชมผู้เขียน! แม้ว่าคุณจะใช้งานได้ฟรี แต่โปรดจำไว้ว่าการเผยแพร่โค้ดซ้ำจะต้องเป็นไปตาม กฎระเบียบการใช้งาน ของเรา
คำจำกัดสิทธิ์ความรับผิดชอบ
ข้อมูลและบทความไม่ได้มีวัตถุประสงค์เพื่อก่อให้เกิดกิจกรรมทางการเงิน, การลงทุน, การซื้อขาย, ข้อเสนอแนะ หรือคำแนะนำประเภทอื่น ๆ ที่ให้หรือรับรองโดย TradingView อ่านเพิ่มเติมใน ข้อกำหนดการใช้งาน
สคริปต์โอเพนซอร์ซ
ด้วยเจตนารมณ์หลักของ TradingView ผู้สร้างสคริปต์นี้ได้ทำให้เป็นโอเพนซอร์ส เพื่อให้เทรดเดอร์สามารถตรวจสอบและยืนยันฟังก์ชันการทำงานของมันได้ ขอชื่นชมผู้เขียน! แม้ว่าคุณจะใช้งานได้ฟรี แต่โปรดจำไว้ว่าการเผยแพร่โค้ดซ้ำจะต้องเป็นไปตาม กฎระเบียบการใช้งาน ของเรา
คำจำกัดสิทธิ์ความรับผิดชอบ
ข้อมูลและบทความไม่ได้มีวัตถุประสงค์เพื่อก่อให้เกิดกิจกรรมทางการเงิน, การลงทุน, การซื้อขาย, ข้อเสนอแนะ หรือคำแนะนำประเภทอื่น ๆ ที่ให้หรือรับรองโดย TradingView อ่านเพิ่มเติมใน ข้อกำหนดการใช้งาน