OPEN-SOURCE SCRIPT
Diodato 'All Stars Align' Signal
Description:
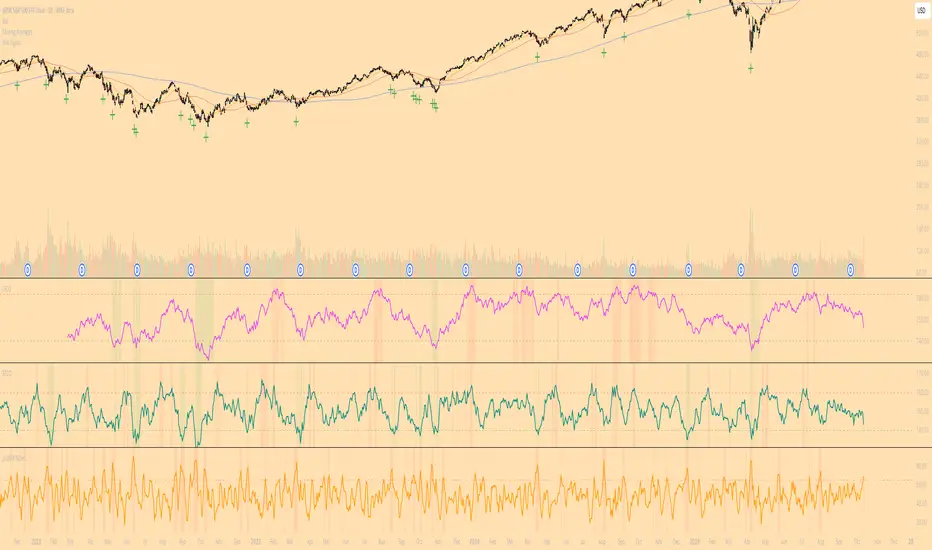
This indicator is an overlay that plots the "All Stars Align" buy signal from Chris Diodato's 2019 CMT paper, "Making The Most Of Panic." It is designed to identify high-conviction, short-term buying opportunities by requiring a confluence of both price-based momentum and market-internal weakness.
What It Is
This script works entirely in the background, calculating three separate indicators: the 14-day Slow Stochastic, the Short-Term Capitulation Oscillator (STCO), and the 3-DMA of % Declining Issues. It then plots a signal directly on the main price chart only when the specific "All Stars Align" conditions are met.
How to Interpret
A green cross (+) appears below a price bar when a high-conviction buy signal is generated. This signal triggers only when two primary conditions are true:
The 14-day Slow Stochastic is in "oversold" territory (e.g., below 20).
AND at least one of the market internal indicators shows a state of panic:
Either the STCO is oversold (e.g., below 140).
Or the 3-DMA % Declines shows a panic spike (e.g., above 65).
This confluence signifies a potential exhaustion of sellers and can mark an opportune moment to look for entries.
Settings
Trigger Thresholds: You can customize the exact levels that define an "oversold" or "panic" state for each of the three underlying indicators.
Data Sources: Allows toggling the use of "Unchanged" data for the background calculations.
Stochastic Settings: You can adjust the parameters for the Slow Stochastic calculation.
สคริปต์โอเพนซอร์ซ
ด้วยเจตนารมณ์หลักของ TradingView ผู้สร้างสคริปต์นี้ได้ทำให้เป็นโอเพนซอร์ส เพื่อให้เทรดเดอร์สามารถตรวจสอบและยืนยันฟังก์ชันการทำงานของมันได้ ขอชื่นชมผู้เขียน! แม้ว่าคุณจะใช้งานได้ฟรี แต่โปรดจำไว้ว่าการเผยแพร่โค้ดซ้ำจะต้องเป็นไปตาม กฎระเบียบการใช้งาน ของเรา
คำจำกัดสิทธิ์ความรับผิดชอบ
ข้อมูลและบทความไม่ได้มีวัตถุประสงค์เพื่อก่อให้เกิดกิจกรรมทางการเงิน, การลงทุน, การซื้อขาย, ข้อเสนอแนะ หรือคำแนะนำประเภทอื่น ๆ ที่ให้หรือรับรองโดย TradingView อ่านเพิ่มเติมใน ข้อกำหนดการใช้งาน