PROTECTED SOURCE SCRIPT
ที่อัปเดต: Equal Highs/Lows
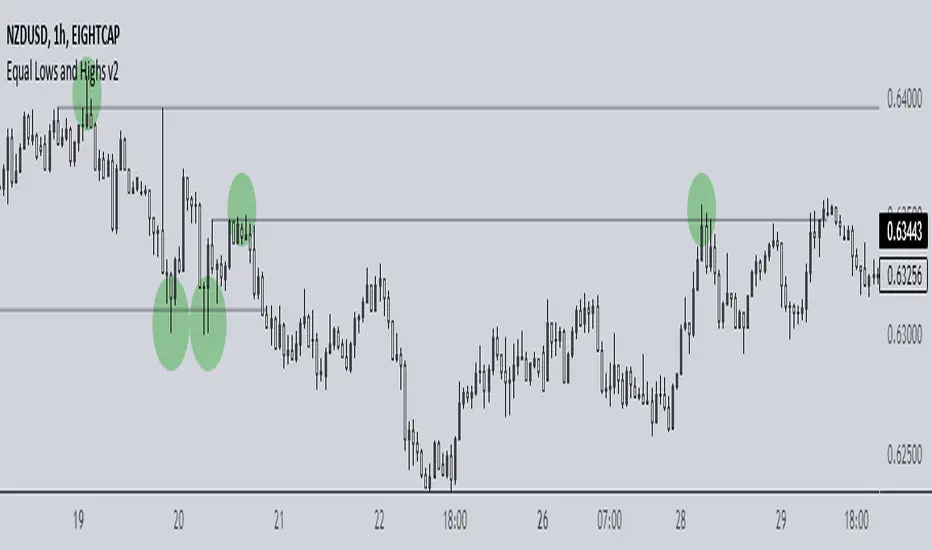
This indicator checks for equal highs/lows using the previous three pivots at any given time. This is helpful for identifying where liquidity lies and where a likely sweep/SFP may occur.
You can choose the bar size for the pivots to check for in order to detect desirable levels as well as adjust the acceptable deviation for near-equal highs/lows.
By default, the settings are ideal for BTC in the 5-15m charts. Deviation would need to be set in the decimals for lower-priced symbols and experimentation is recommended.
เอกสารเผยแพร่
- Updated script to avoid redrawing levels- Replaced "tracking" with labels
- Added option to check for equal highs/lows on consecutive candles
เอกสารเผยแพร่
Added ability to change eqh/l colorsเอกสารเผยแพร่
This script has been completely redone to reduce complexity. Now checks for equal highs/low, plots, and removes them if future prices exceed them.เอกสารเผยแพร่
Added symbol to eqh/ls to represent liquidityเอกสารเผยแพร่
This indicator should now work with all symbols - feel free to provide feedback if there are any issuesเอกสารเผยแพร่
- Reduced number of lines (previously 500 and now 15)- Added option to adjust sensitivity on equal highs/lows
เอกสารเผยแพร่
Added alertsเอกสารเผยแพร่
- Added tooltip for indicator sensitivity input- Removed liquidity label/text color from inputs
เอกสารเผยแพร่
Added input for max linesเอกสารเผยแพร่
- Updated input grouping- Added alerts options if you exclusively want equal highs or lows
เอกสารเผยแพร่
Shows equal highs and lows which usually indicates a large amount of liquidity beyond them. This information can guide decisions when price sweeps these areas then reverses direction (SFPs). In addition, these areas may indicate a potential break up/down as price fails to hold beneath/above.Improvements include:
- New codebase to detect equal lows/highs
- Shows historical areas for easier backtesting
- Granular input for sensitivity based on timeframe
เอกสารเผยแพร่
Added the option for symbols in addition to the usual lines สคริปต์ที่ได้รับการป้องกัน
สคริปต์นี้ถูกเผยแพร่เป็นแบบ closed-source อย่างไรก็ตาม คุณสามารถใช้ได้อย่างอิสระและไม่มีข้อจำกัดใดๆ – เรียนรู้เพิ่มเติมได้ที่นี่
คำจำกัดสิทธิ์ความรับผิดชอบ
ข้อมูลและบทความไม่ได้มีวัตถุประสงค์เพื่อก่อให้เกิดกิจกรรมทางการเงิน, การลงทุน, การซื้อขาย, ข้อเสนอแนะ หรือคำแนะนำประเภทอื่น ๆ ที่ให้หรือรับรองโดย TradingView อ่านเพิ่มเติมใน ข้อกำหนดการใช้งาน
สคริปต์ที่ได้รับการป้องกัน
สคริปต์นี้ถูกเผยแพร่เป็นแบบ closed-source อย่างไรก็ตาม คุณสามารถใช้ได้อย่างอิสระและไม่มีข้อจำกัดใดๆ – เรียนรู้เพิ่มเติมได้ที่นี่
คำจำกัดสิทธิ์ความรับผิดชอบ
ข้อมูลและบทความไม่ได้มีวัตถุประสงค์เพื่อก่อให้เกิดกิจกรรมทางการเงิน, การลงทุน, การซื้อขาย, ข้อเสนอแนะ หรือคำแนะนำประเภทอื่น ๆ ที่ให้หรือรับรองโดย TradingView อ่านเพิ่มเติมใน ข้อกำหนดการใช้งาน