OPEN-SOURCE SCRIPT
Adjustable Percentage Range Moving Average
Adjustable Percentage Range Moving Average (APRMA)
The Adjustable Percentage Range Moving Average (APRMA) is a technical analysis tool designed for traders and market analysts who seek a dynamic approach to understanding market volatility and trend identification. Unlike traditional moving averages, the APRMA incorporates user-adjustable percentage bands around a central moving average line, offering a customizable view of price action relative to its recent history.
Key Features:
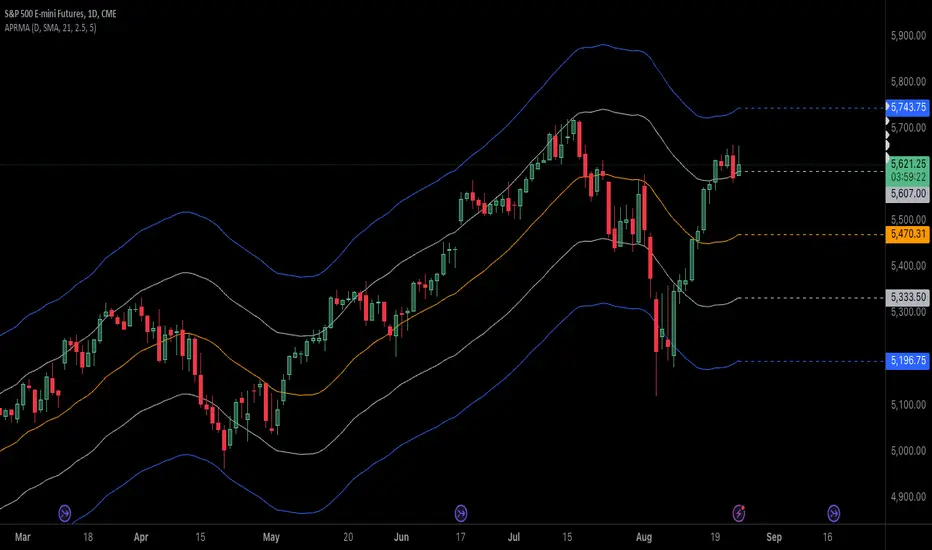
Central Moving Average: At its core, APRMA calculates a moving average (type of your choice) of the price over a specified number of periods, serving as the baseline for the indicator.
Percentage Bands: Surrounding the moving average are four bands, two above and two below, set at user-defined percentages away from the central line. These bands expand and contract based on the percentage input, not on standard deviation like Bollinger Bands, which allows for a consistent visual interpretation of how far the price has moved from its average.
Customizability: Users can adjust:
The length of the moving average period to suit short-term, medium-term, or long-term analysis.
The percentage offset for the bands, enabling traders to set the sensitivity of the indicator according to the asset's volatility or their trading strategy.
Visual Interpretation:
When the price moves towards or beyond the upper band, it might indicate that the asset is potentially overbought or that a strong upward trend is in place.
Conversely, price action near or below the lower band could suggest an oversold condition or a strong downward trend.
The space between the bands can be used to gauge volatility; narrower bands suggest lower current volatility relative to the average, while wider bands indicate higher volatility.
Usage in Trading:
Trend Confirmation: A price staying above the moving average and pushing the upper band might confirm an uptrend, while staying below and testing the lower band could confirm a downtrend.
Reversion Strategies: Traders might look for price to revert to the mean (moving average) when it touches or crosses the bands, setting up potential entry or exit points.
Breakout Signals: A price moving decisively through a band after a period of consolidation within the bands might signal a breakout.
The APRMA provides a clear, adaptable framework for traders to visualize where the price stands in relation to its recent average, offering insights into potential overbought/oversold conditions, trend strength, and volatility, all tailored by the trader's strategic preferences.
The Adjustable Percentage Range Moving Average (APRMA) is a technical analysis tool designed for traders and market analysts who seek a dynamic approach to understanding market volatility and trend identification. Unlike traditional moving averages, the APRMA incorporates user-adjustable percentage bands around a central moving average line, offering a customizable view of price action relative to its recent history.
Key Features:
Central Moving Average: At its core, APRMA calculates a moving average (type of your choice) of the price over a specified number of periods, serving as the baseline for the indicator.
Percentage Bands: Surrounding the moving average are four bands, two above and two below, set at user-defined percentages away from the central line. These bands expand and contract based on the percentage input, not on standard deviation like Bollinger Bands, which allows for a consistent visual interpretation of how far the price has moved from its average.
Customizability: Users can adjust:
The length of the moving average period to suit short-term, medium-term, or long-term analysis.
The percentage offset for the bands, enabling traders to set the sensitivity of the indicator according to the asset's volatility or their trading strategy.
Visual Interpretation:
When the price moves towards or beyond the upper band, it might indicate that the asset is potentially overbought or that a strong upward trend is in place.
Conversely, price action near or below the lower band could suggest an oversold condition or a strong downward trend.
The space between the bands can be used to gauge volatility; narrower bands suggest lower current volatility relative to the average, while wider bands indicate higher volatility.
Usage in Trading:
Trend Confirmation: A price staying above the moving average and pushing the upper band might confirm an uptrend, while staying below and testing the lower band could confirm a downtrend.
Reversion Strategies: Traders might look for price to revert to the mean (moving average) when it touches or crosses the bands, setting up potential entry or exit points.
Breakout Signals: A price moving decisively through a band after a period of consolidation within the bands might signal a breakout.
The APRMA provides a clear, adaptable framework for traders to visualize where the price stands in relation to its recent average, offering insights into potential overbought/oversold conditions, trend strength, and volatility, all tailored by the trader's strategic preferences.
สคริปต์โอเพนซอร์ซ
ด้วยเจตนารมณ์หลักของ TradingView ผู้สร้างสคริปต์นี้ได้ทำให้เป็นโอเพนซอร์ส เพื่อให้เทรดเดอร์สามารถตรวจสอบและยืนยันฟังก์ชันการทำงานของมันได้ ขอชื่นชมผู้เขียน! แม้ว่าคุณจะใช้งานได้ฟรี แต่โปรดจำไว้ว่าการเผยแพร่โค้ดซ้ำจะต้องเป็นไปตาม กฎระเบียบการใช้งาน ของเรา
คำจำกัดสิทธิ์ความรับผิดชอบ
ข้อมูลและบทความไม่ได้มีวัตถุประสงค์เพื่อก่อให้เกิดกิจกรรมทางการเงิน, การลงทุน, การซื้อขาย, ข้อเสนอแนะ หรือคำแนะนำประเภทอื่น ๆ ที่ให้หรือรับรองโดย TradingView อ่านเพิ่มเติมใน ข้อกำหนดการใช้งาน