PROTECTED SOURCE SCRIPT
LVG Reversal Indicator

LVG Reversal Indicator:
-----------------------------------------
Shows potential reversal spots.
How to use:
-----------------------------------------
Works best on low time frames and markets that are trading sideways.
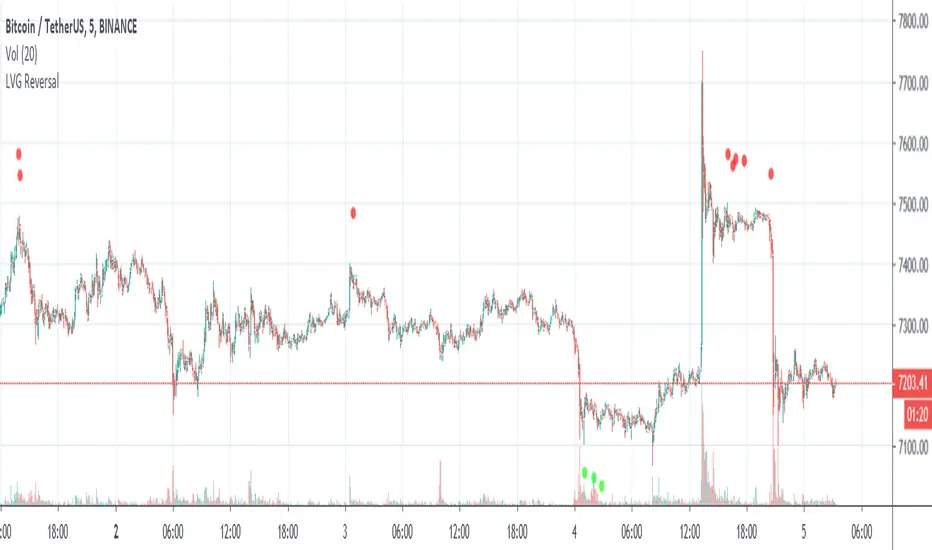
If a potential reversal has been reached it plots a green or a red dot under or above the candlestick .
Green dot = potential buy opportunity
Red dot = potential sell opportunity
If the signals get ignored the market is trending and a big reversal can be expected at the end.
The scripts plots the signals at the opening of the candle.
Does not repaint.
------------------------------------------
Please leave some feedback in the comments.
Use this indicator at your own risk.
-----------------------------------------
Shows potential reversal spots.
How to use:
-----------------------------------------
Works best on low time frames and markets that are trading sideways.
If a potential reversal has been reached it plots a green or a red dot under or above the candlestick .
Green dot = potential buy opportunity
Red dot = potential sell opportunity
If the signals get ignored the market is trending and a big reversal can be expected at the end.
The scripts plots the signals at the opening of the candle.
Does not repaint.
------------------------------------------
Please leave some feedback in the comments.
Use this indicator at your own risk.
สคริปต์ที่ได้รับการป้องกัน
สคริปต์นี้ถูกเผยแพร่เป็นแบบ closed-source อย่างไรก็ตาม คุณสามารถใช้ได้อย่างอิสระและไม่มีข้อจำกัดใดๆ – เรียนรู้เพิ่มเติมได้ที่นี่
คำจำกัดสิทธิ์ความรับผิดชอบ
ข้อมูลและบทความไม่ได้มีวัตถุประสงค์เพื่อก่อให้เกิดกิจกรรมทางการเงิน, การลงทุน, การซื้อขาย, ข้อเสนอแนะ หรือคำแนะนำประเภทอื่น ๆ ที่ให้หรือรับรองโดย TradingView อ่านเพิ่มเติมใน ข้อกำหนดการใช้งาน