OPEN-SOURCE SCRIPT
ที่อัปเดต: Indices Tracker and VOLD-Market Breadth
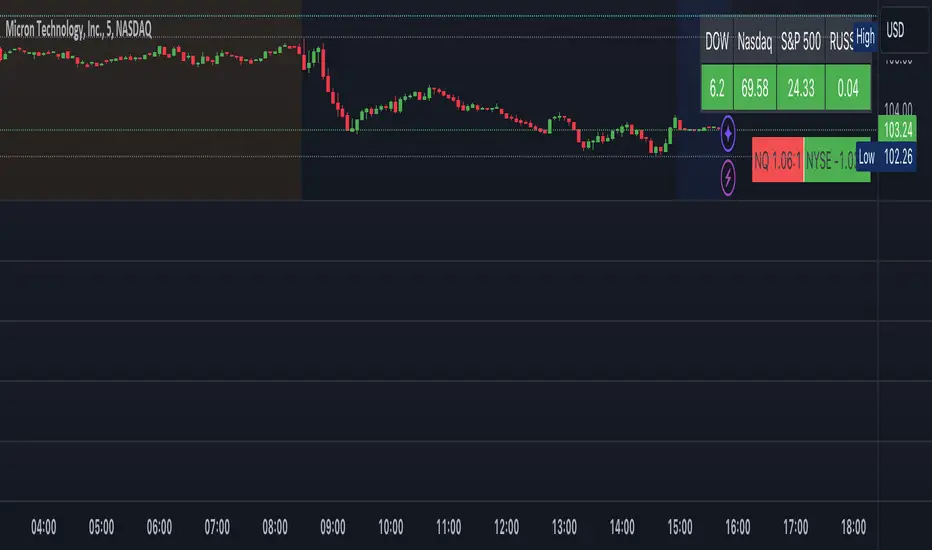
This is an overlay displaying DOW, Nasdaq and S&P performance for the day in real-time along with NQ and NYSE market breadth display.
Overview of the Script:
The Dow, Nasdaq, S&P Tracker section is at the top, displaying the current index values, changes, and colors.
The VOLD-Market Breadth section is below, providing the market breadth information.
Helpful to get a market view while trading stocks or options directionally.
Overview of the Script:
The Dow, Nasdaq, S&P Tracker section is at the top, displaying the current index values, changes, and colors.
The VOLD-Market Breadth section is below, providing the market breadth information.
Helpful to get a market view while trading stocks or options directionally.
เอกสารเผยแพร่
Basic script overlaying US market indices (Dow, Nasdaq, S&P and Russel) on the chart along with market breadth information of NQ and NYSE.Ready reference while exploring other stocks for trading.
สคริปต์โอเพนซอร์ซ
ด้วยเจตนารมณ์หลักของ TradingView ผู้สร้างสคริปต์นี้ได้ทำให้เป็นโอเพนซอร์ส เพื่อให้เทรดเดอร์สามารถตรวจสอบและยืนยันฟังก์ชันการทำงานของมันได้ ขอชื่นชมผู้เขียน! แม้ว่าคุณจะใช้งานได้ฟรี แต่โปรดจำไว้ว่าการเผยแพร่โค้ดซ้ำจะต้องเป็นไปตาม กฎระเบียบการใช้งาน ของเรา
คำจำกัดสิทธิ์ความรับผิดชอบ
ข้อมูลและบทความไม่ได้มีวัตถุประสงค์เพื่อก่อให้เกิดกิจกรรมทางการเงิน, การลงทุน, การซื้อขาย, ข้อเสนอแนะ หรือคำแนะนำประเภทอื่น ๆ ที่ให้หรือรับรองโดย TradingView อ่านเพิ่มเติมใน ข้อกำหนดการใช้งาน