OPEN-SOURCE SCRIPT
ที่อัปเดต: Market Performance Table

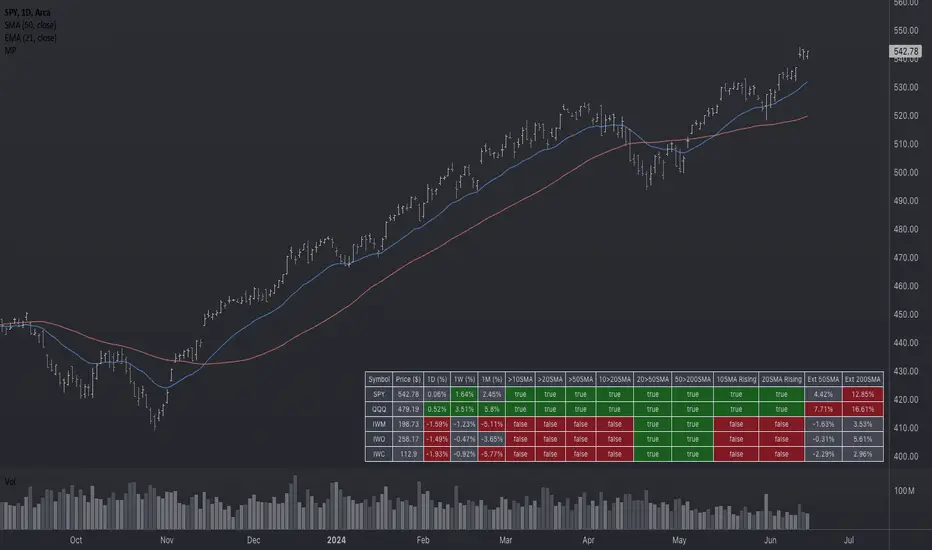
The Market Performance Table displays the performance of multiple tickers (up to 5) in a table format. The tickers can be customized by selecting them through the indicator settings.
The indicator calculates various metrics for each ticker, including the 1-day change percentage, whether the price is above the 50, 20, and 10-day simple moving averages (SMA), as well as the relative strength compared to the 10/20 SMA and 20/50 SMA crossovers. It also calculates the price deviation from the 50-day SMA.
The table is displayed on the chart and can be positioned in different locations.
Credits for the idea to Alex_PrimeTrading ;)
เอกสารเผยแพร่
Update Version 2.0Switch Between SMA and EMA:
- Added an option to toggle between Simple Moving Average (SMA) and Exponential Moving Average (EMA) for all calculations.
- The column titles dynamically change based on the selected moving average type.
1-Week and 1-Month Rate of Change:
- Added columns to display the 1-week (5 days) and 1-month (21 days) rate of change percentages.
Reordered Columns:
- Changed the order of the moving average columns from [>50, >20, >10] to [>10, >20, >50] for better readability.
Background Color for Change Columns:
- Implemented color-coding for the rate of change columns based on thresholds:
- 1-Day Change: Green if > 0.1%, Red if < 0%, Gray otherwise.
- 1-Week Change: Green if > 1%, Red if < 0%, Gray otherwise.
- 1-Month Change: Green if > 5%, Red if < 0%, Gray otherwise.
Extension Thresholds for 50 and 200 Moving Averages:
- Added input options for setting thresholds for the extension percentages from the 50-period and 200-period moving averages.
- The color coding is reversed based on these thresholds:
- Red if above the positive threshold.
- Green if below the negative threshold.
- Gray otherwise.
Rising Moving Averages:
- Added indicators to show if the 10-period and 20-period moving averages are rising from the previous day.
Enhanced Color Customization:
- Updated the color variables for bullish, bearish, and neutral cells.
- Adjusted transparency settings for better visual clarity.
สคริปต์โอเพนซอร์ซ
ด้วยเจตนารมณ์หลักของ TradingView ผู้สร้างสคริปต์นี้ได้ทำให้เป็นโอเพนซอร์ส เพื่อให้เทรดเดอร์สามารถตรวจสอบและยืนยันฟังก์ชันการทำงานของมันได้ ขอชื่นชมผู้เขียน! แม้ว่าคุณจะใช้งานได้ฟรี แต่โปรดจำไว้ว่าการเผยแพร่โค้ดซ้ำจะต้องเป็นไปตาม กฎระเบียบการใช้งาน ของเรา
คำจำกัดสิทธิ์ความรับผิดชอบ
ข้อมูลและบทความไม่ได้มีวัตถุประสงค์เพื่อก่อให้เกิดกิจกรรมทางการเงิน, การลงทุน, การซื้อขาย, ข้อเสนอแนะ หรือคำแนะนำประเภทอื่น ๆ ที่ให้หรือรับรองโดย TradingView อ่านเพิ่มเติมใน ข้อกำหนดการใช้งาน