OPEN-SOURCE SCRIPT
GP - Long Short Scanner
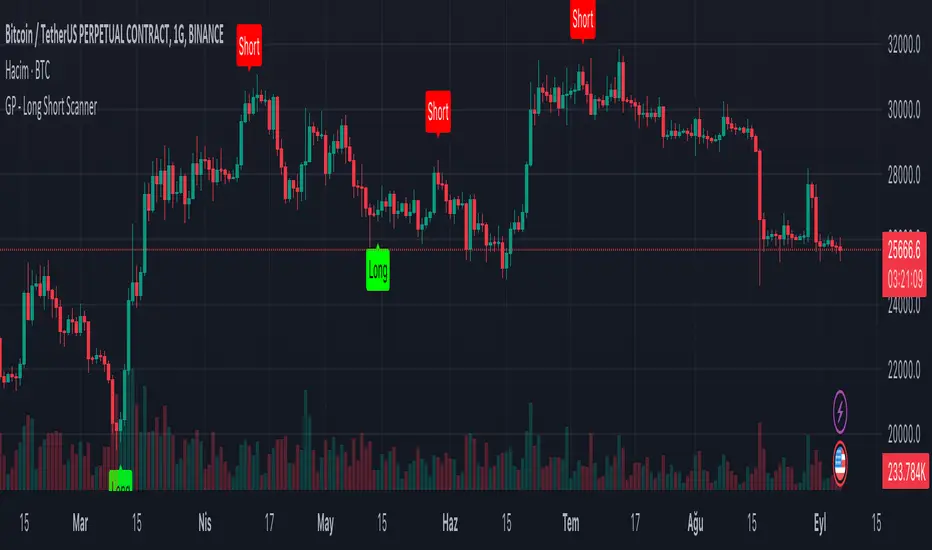
This script is made to predict the point at which price-time charts will rise or fall. The script was inspired by the RSI and TSI formulas. The formula is simply; Calculates the RSI and TSI values of open, high, low and close. Calculated values are converted to an array. The maximum and minimum values in the array are taken for the candles included in the calculation. These values calculate the time when the "Long" label will be seen on the chart of the candle that will increase the price. At the same time, it calculates the time when the "Short" label will appear on the chart of the candle that will decrease the price. Although these calculations are not precise; Seeing the “Long” label means that the price will rise at that candle, and seeing the “Short” label means that the price will decrease at that candle. The “Long”, “Short” tags from this script alone should not be used to determine the direction of the price. It can be used on all price-time charts.
สคริปต์โอเพนซอร์ซ
ด้วยเจตนารมณ์หลักของ TradingView ผู้สร้างสคริปต์นี้ได้ทำให้เป็นโอเพนซอร์ส เพื่อให้เทรดเดอร์สามารถตรวจสอบและยืนยันฟังก์ชันการทำงานของมันได้ ขอชื่นชมผู้เขียน! แม้ว่าคุณจะใช้งานได้ฟรี แต่โปรดจำไว้ว่าการเผยแพร่โค้ดซ้ำจะต้องเป็นไปตาม กฎระเบียบการใช้งาน ของเรา
คำจำกัดสิทธิ์ความรับผิดชอบ
ข้อมูลและบทความไม่ได้มีวัตถุประสงค์เพื่อก่อให้เกิดกิจกรรมทางการเงิน, การลงทุน, การซื้อขาย, ข้อเสนอแนะ หรือคำแนะนำประเภทอื่น ๆ ที่ให้หรือรับรองโดย TradingView อ่านเพิ่มเติมใน ข้อกำหนดการใช้งาน