OPEN-SOURCE SCRIPT
ที่อัปเดต: Liquidity Optimal Lag
1.0.
เอกสารเผยแพร่
This script is designed to assess the impact of liquidity from Federal Reserve operations on asset prices, allowing for customizable weightings and analysis of correlations between liquidity factors and selected assets like Bitcoin (BTC), Ethereum (ETH), or Solana (SOL). The primary objective is to understand how different liquidity inputs affect the price of these assets and to visualize correlations over time with adjustable settings.Key Features:
1. Liquidity Calculation with Adjustable Weightings:
- The script pulls data from the Federal Reserve's balance sheet and other relevant liquidity sources such as the Treasury General Account (TGA), Reverse Repo Payments (RRP), Bank Term Funding Program (BTFP), and the Discount Window.
- Users can experiment with different weightings for each liquidity factor, allowing for flexibility in how each component contributes to overall liquidity.
- The final liquidity figure is normalized for better comparison and can be offset by a user-defined period for improved lag analysis.
2. Correlation and Statistical Analysis:
- The script calculates the correlation (`r`) between the selected asset's price (BTC, ETH, or SOL) and the offset liquidity data over a customizable correlation period.
- Additionally, the R-squared (`r²`) value is computed to measure the strength of the relationship between liquidity and asset prices.
- Smoothing can be applied to the correlation data using a simple moving average (SMA), and both the raw and smoothed correlation values are plotted.
3. Customizable Inputs:
- Asset Selection: Choose between Bitcoin (BTC), Ethereum (ETH), or Solana (SOL) to compare their prices against the liquidity data.
- Weighting: Adjust weightings for the Fed Balance Sheet, TGA, RRP, BTFP, and Discount Window to experiment with how each liquidity source impacts the overall calculation.
- Correlation Settings: Fine-tune the correlation analysis using adjustable periods, smoothing, and an offset for liquidity.
- Display Options: Toggle the visibility of Net Fed Liquidity, Correlation, and Average Correlation on the chart.
4. Visual Representation:
- The script plots the following on the chart:
- Net Fed Liquidity: The offset and normalized liquidity value.
- Correlation: The correlation coefficient between liquidity and the asset price.
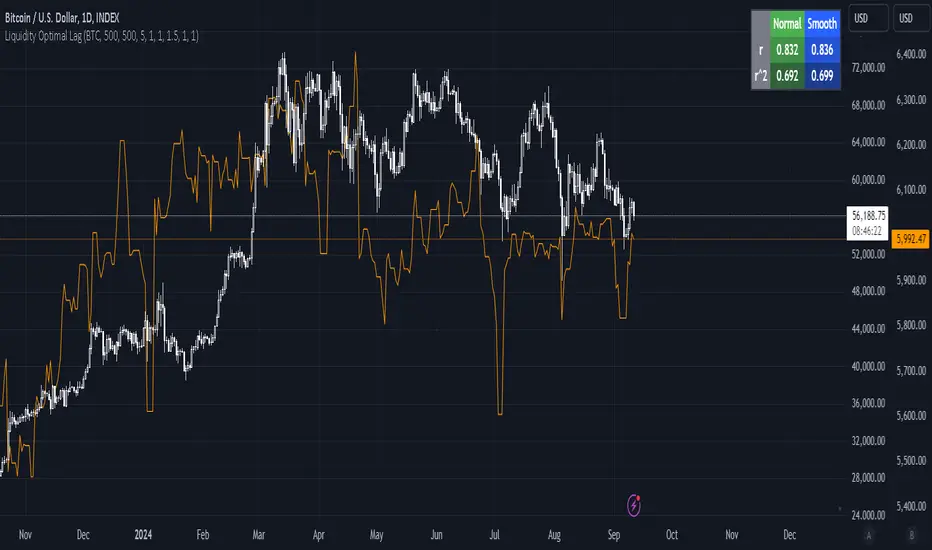
- Average Correlation: A smoothed version of the correlation using a moving average.
- A table in the top-right corner displays the real-time and average correlation (`r`) and R-squared (`r²`) values for easier interpretation.
This tool is ideal for traders and analysts interested in understanding the lag effect of liquidity on asset prices and experimenting with various liquidity weightings to find the optimal configuration.
เอกสารเผยแพร่
3.0สคริปต์โอเพนซอร์ซ
ด้วยเจตนารมณ์หลักของ TradingView ผู้สร้างสคริปต์นี้ได้ทำให้เป็นโอเพนซอร์ส เพื่อให้เทรดเดอร์สามารถตรวจสอบและยืนยันฟังก์ชันการทำงานของมันได้ ขอชื่นชมผู้เขียน! แม้ว่าคุณจะใช้งานได้ฟรี แต่โปรดจำไว้ว่าการเผยแพร่โค้ดซ้ำจะต้องเป็นไปตาม กฎระเบียบการใช้งาน ของเรา
คำจำกัดสิทธิ์ความรับผิดชอบ
ข้อมูลและบทความไม่ได้มีวัตถุประสงค์เพื่อก่อให้เกิดกิจกรรมทางการเงิน, การลงทุน, การซื้อขาย, ข้อเสนอแนะ หรือคำแนะนำประเภทอื่น ๆ ที่ให้หรือรับรองโดย TradingView อ่านเพิ่มเติมใน ข้อกำหนดการใช้งาน
สคริปต์โอเพนซอร์ซ
ด้วยเจตนารมณ์หลักของ TradingView ผู้สร้างสคริปต์นี้ได้ทำให้เป็นโอเพนซอร์ส เพื่อให้เทรดเดอร์สามารถตรวจสอบและยืนยันฟังก์ชันการทำงานของมันได้ ขอชื่นชมผู้เขียน! แม้ว่าคุณจะใช้งานได้ฟรี แต่โปรดจำไว้ว่าการเผยแพร่โค้ดซ้ำจะต้องเป็นไปตาม กฎระเบียบการใช้งาน ของเรา
คำจำกัดสิทธิ์ความรับผิดชอบ
ข้อมูลและบทความไม่ได้มีวัตถุประสงค์เพื่อก่อให้เกิดกิจกรรมทางการเงิน, การลงทุน, การซื้อขาย, ข้อเสนอแนะ หรือคำแนะนำประเภทอื่น ๆ ที่ให้หรือรับรองโดย TradingView อ่านเพิ่มเติมใน ข้อกำหนดการใช้งาน