OPEN-SOURCE SCRIPT
Pivots Support Resistance Zone
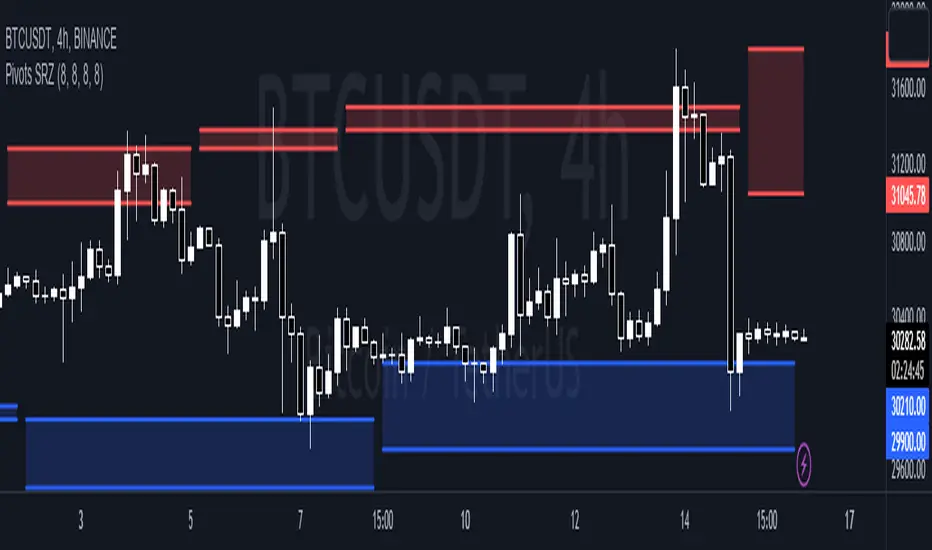
This simple script base on function of Pivot High Low to plot Support and Resistance Zone on chart with detail as below:
1. Support Zone
+ New Pivot Low is plotted
+ New Pivot Low lower previous Pivot Low
+ Upper Line of Support Zone is previous Pivot Low
+ Lower Line of Support Zone is new Pivot Low
2. Resistance Zone
+ New Pivot High is plotted
+ New Pivot High higher previous Pivot High
+ Upper Line of Resistance Zone is new Pivot High
+ Lower Line of Resistance Zone is previous Pivot High
สคริปต์โอเพนซอร์ซ
ด้วยเจตนารมณ์หลักของ TradingView ผู้สร้างสคริปต์นี้ได้ทำให้เป็นโอเพนซอร์ส เพื่อให้เทรดเดอร์สามารถตรวจสอบและยืนยันฟังก์ชันการทำงานของมันได้ ขอชื่นชมผู้เขียน! แม้ว่าคุณจะใช้งานได้ฟรี แต่โปรดจำไว้ว่าการเผยแพร่โค้ดซ้ำจะต้องเป็นไปตาม กฎระเบียบการใช้งาน ของเรา
คำจำกัดสิทธิ์ความรับผิดชอบ
ข้อมูลและบทความไม่ได้มีวัตถุประสงค์เพื่อก่อให้เกิดกิจกรรมทางการเงิน, การลงทุน, การซื้อขาย, ข้อเสนอแนะ หรือคำแนะนำประเภทอื่น ๆ ที่ให้หรือรับรองโดย TradingView อ่านเพิ่มเติมใน ข้อกำหนดการใช้งาน