OPEN-SOURCE SCRIPT
ที่อัปเดต: FlipTracker
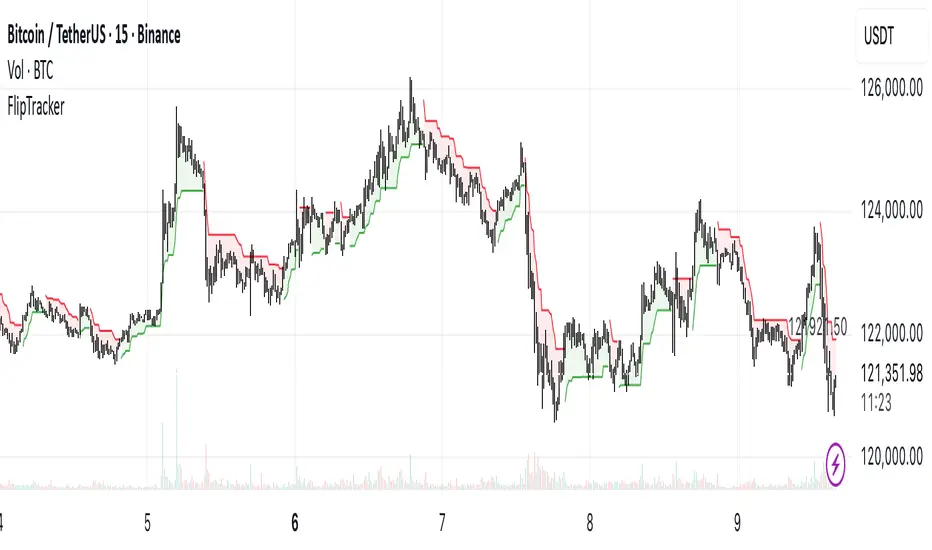
The FlipTracker is calculated using the Average True Range (ATR) to determine the indicator’s sensitivity to market volatility.
It plots a line above or below the price depending on whether the trend is bearish or bullish:
🟩 Bullish Trend – Price closes above the FlipTracker line.
🟥 Bearish Trend – Price closes below the FlipTracker line.
When the direction flips (price crossing the FlipTracker), the indicator changes color and provides a potential trend reversal signal.
เอกสารเผยแพร่
FlipTrackerสคริปต์โอเพนซอร์ซ
ด้วยเจตนารมณ์หลักของ TradingView ผู้สร้างสคริปต์นี้ได้ทำให้มันเป็นโอเพ่นซอร์ส เพื่อให้เทรดเดอร์สามารถตรวจสอบและยืนยันการทำงานของสคริปต์ได้ ขอแสดงความชื่นชมผู้เขียน! แม้ว่าคุณจะสามารถใช้งานได้ฟรี แต่อย่าลืมว่าการเผยแพร่โค้ดซ้ำนั้นจะต้องเป็นไปตามกฎระเบียบการใช้งานของเรา
คำจำกัดสิทธิ์ความรับผิดชอบ
ข้อมูลและบทความไม่ได้มีวัตถุประสงค์เพื่อก่อให้เกิดกิจกรรมทางการเงิน, การลงทุน, การซื้อขาย, ข้อเสนอแนะ หรือคำแนะนำประเภทอื่น ๆ ที่ให้หรือรับรองโดย TradingView อ่านเพิ่มเติมที่ ข้อกำหนดการใช้งาน
สคริปต์โอเพนซอร์ซ
ด้วยเจตนารมณ์หลักของ TradingView ผู้สร้างสคริปต์นี้ได้ทำให้มันเป็นโอเพ่นซอร์ส เพื่อให้เทรดเดอร์สามารถตรวจสอบและยืนยันการทำงานของสคริปต์ได้ ขอแสดงความชื่นชมผู้เขียน! แม้ว่าคุณจะสามารถใช้งานได้ฟรี แต่อย่าลืมว่าการเผยแพร่โค้ดซ้ำนั้นจะต้องเป็นไปตามกฎระเบียบการใช้งานของเรา
คำจำกัดสิทธิ์ความรับผิดชอบ
ข้อมูลและบทความไม่ได้มีวัตถุประสงค์เพื่อก่อให้เกิดกิจกรรมทางการเงิน, การลงทุน, การซื้อขาย, ข้อเสนอแนะ หรือคำแนะนำประเภทอื่น ๆ ที่ให้หรือรับรองโดย TradingView อ่านเพิ่มเติมที่ ข้อกำหนดการใช้งาน