PROTECTED SOURCE SCRIPT
Bottom Indicator
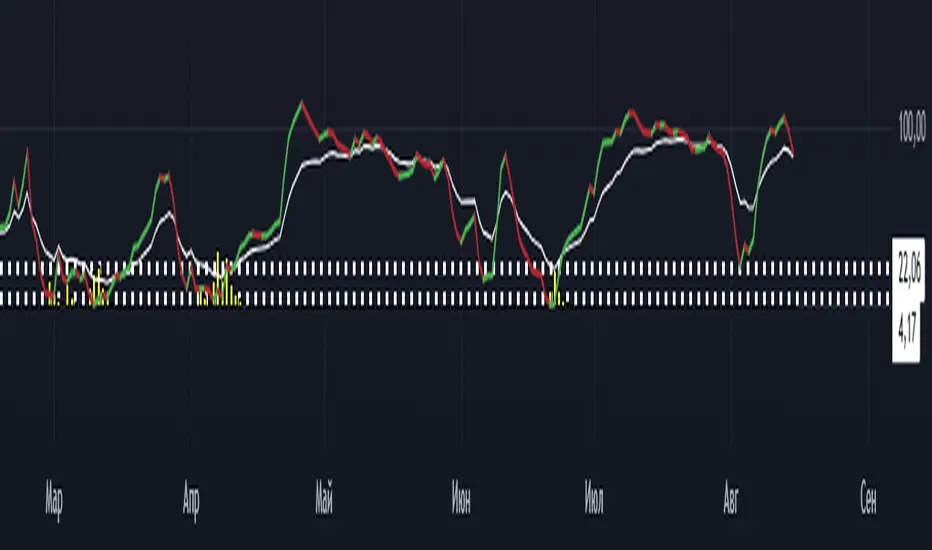
Indicator" identifies when the price is hitting local lows and large players might be stepping in (signaled by a yellow histogram). It overlays a KDJ oscillator and considers it a strong long signal if the purple (J) line is below 4, the white (K) line is below 22, and the yellow histogram is present. In other words, it spots a deeply oversold condition with big player activity as a prime buying opportunity.
สคริปต์ที่ได้รับการป้องกัน
สคริปต์นี้ถูกเผยแพร่เป็นแบบ closed-source อย่างไรก็ตาม คุณสามารถใช้ได้อย่างอิสระและไม่มีข้อจำกัดใดๆ – เรียนรู้เพิ่มเติมได้ที่นี่
คำจำกัดสิทธิ์ความรับผิดชอบ
ข้อมูลและบทความไม่ได้มีวัตถุประสงค์เพื่อก่อให้เกิดกิจกรรมทางการเงิน, การลงทุน, การซื้อขาย, ข้อเสนอแนะ หรือคำแนะนำประเภทอื่น ๆ ที่ให้หรือรับรองโดย TradingView อ่านเพิ่มเติมใน ข้อกำหนดการใช้งาน