OPEN-SOURCE SCRIPT
GS_Opening-Range-V1
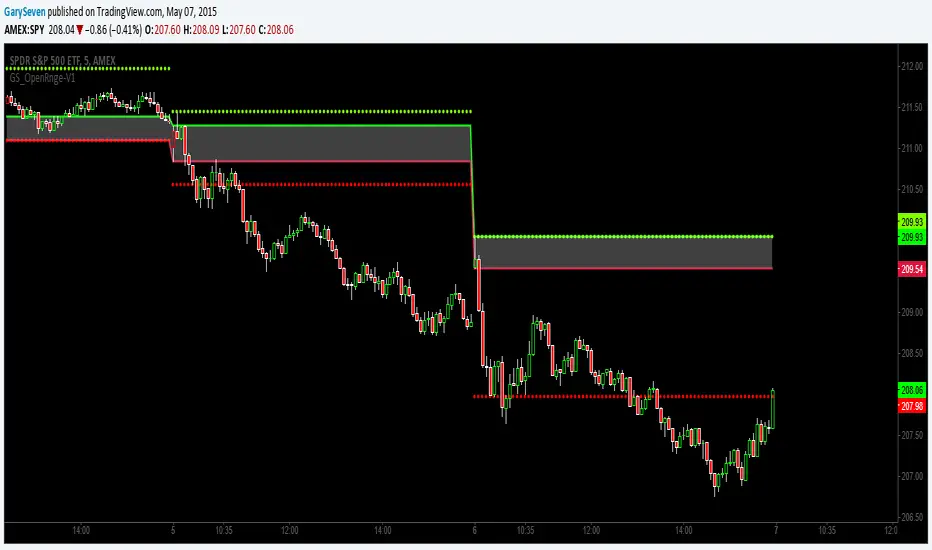
ORB Opening Range Breakout 5 and 3O Minute Indicator
Kudos to Chris Moody for the inspiration to create my first indicator.
The 5 and 30 run together at times but the scalp would be when the equity breaks the 5 go long or short for the scalp and when it breaks the 30 go for the swing trade.
Kudos to Chris Moody for the inspiration to create my first indicator.
The 5 and 30 run together at times but the scalp would be when the equity breaks the 5 go long or short for the scalp and when it breaks the 30 go for the swing trade.
สคริปต์โอเพนซอร์ซ
ด้วยเจตนารมณ์หลักของ TradingView ผู้สร้างสคริปต์นี้ได้ทำให้เป็นโอเพนซอร์ส เพื่อให้เทรดเดอร์สามารถตรวจสอบและยืนยันฟังก์ชันการทำงานของมันได้ ขอชื่นชมผู้เขียน! แม้ว่าคุณจะใช้งานได้ฟรี แต่โปรดจำไว้ว่าการเผยแพร่โค้ดซ้ำจะต้องเป็นไปตาม กฎระเบียบการใช้งาน ของเรา
คำจำกัดสิทธิ์ความรับผิดชอบ
ข้อมูลและบทความไม่ได้มีวัตถุประสงค์เพื่อก่อให้เกิดกิจกรรมทางการเงิน, การลงทุน, การซื้อขาย, ข้อเสนอแนะ หรือคำแนะนำประเภทอื่น ๆ ที่ให้หรือรับรองโดย TradingView อ่านเพิ่มเติมใน ข้อกำหนดการใช้งาน