PROTECTED SOURCE SCRIPT
Bitcoin long term trends
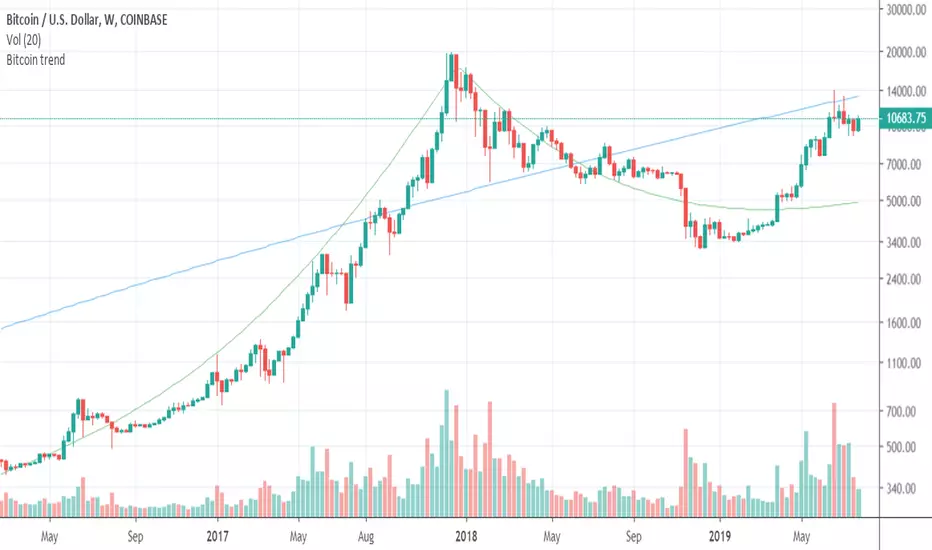
This script shows the long term trends in Bitcoin price.
It is based on my mathematical formula for the long term trends.
The blue line is a long term trend as a power function B = (t/693)^5.526
And the green line is a more sophisticated trend, which models the wave behavior over the whole history of bitcoin.
This script is only applicable to BTCUSD price. The trend lines are calculated as the functions of time only.
 BTCUSD
It is based on my mathematical formula for the long term trends.
The blue line is a long term trend as a power function B = (t/693)^5.526
And the green line is a more sophisticated trend, which models the wave behavior over the whole history of bitcoin.
This script is only applicable to BTCUSD price. The trend lines are calculated as the functions of time only.
สคริปต์ที่ได้รับการป้องกัน
สคริปต์นี้ถูกเผยแพร่เป็นแบบ closed-source อย่างไรก็ตาม คุณสามารถใช้ได้อย่างอิสระและไม่มีข้อจำกัดใดๆ – เรียนรู้เพิ่มเติมได้ที่นี่
คำจำกัดสิทธิ์ความรับผิดชอบ
ข้อมูลและบทความไม่ได้มีวัตถุประสงค์เพื่อก่อให้เกิดกิจกรรมทางการเงิน, การลงทุน, การซื้อขาย, ข้อเสนอแนะ หรือคำแนะนำประเภทอื่น ๆ ที่ให้หรือรับรองโดย TradingView อ่านเพิ่มเติมใน ข้อกำหนดการใช้งาน