OPEN-SOURCE SCRIPT
ที่อัปเดต: Running Minimum High
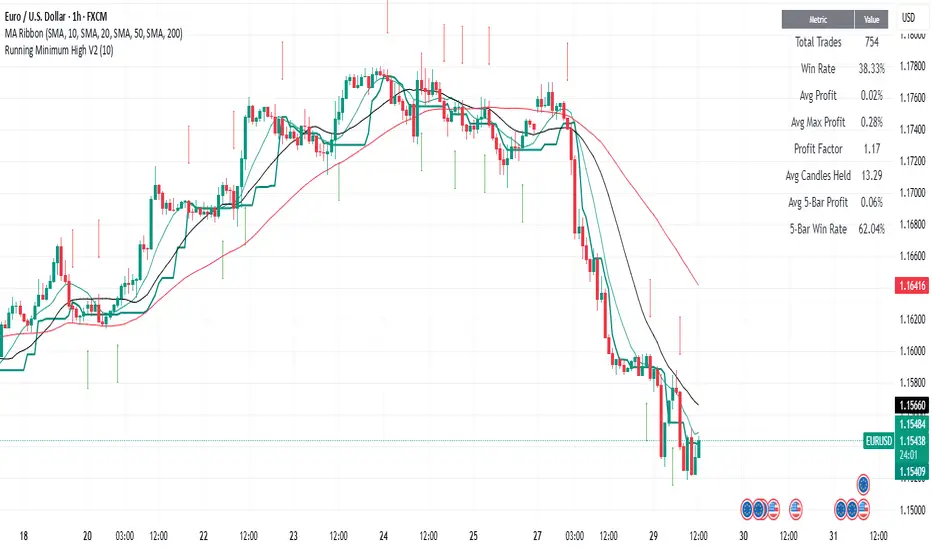
The running minimum high looks at the minimum high from a defined lookback period (default 10 days) and plots that on the price chart. Green arrows signify when the low of the candle is above the running minimum high (suggesting an uptrend), and red arrows signify when the high of the candle is below the running minimum high (suggesting a downtrend).
It is recommended to use this on high timeframes (e.g. 1 hour and above) given the high number of signals it generates on lower timeframes.
It is recommended to use this on high timeframes (e.g. 1 hour and above) given the high number of signals it generates on lower timeframes.
เอกสารเผยแพร่
The running minimum high looks at the minimum high from a defined lookback period (default 10 days) and plots that on the price chart. Green arrows signify when the low of the candle is above the running minimum high (suggesting an uptrend), and red arrows signify when the close of the candle is below the running minimum high (suggesting a downtrend).It is recommended to use this on high timeframes (e.g. 1 hour and above) given the high number of signals it generates on lower timeframes.
EDIT: Changed exit signal to when close is below minimum high.
เอกสารเผยแพร่
JULY 29TH UPDATE: Includes profit table, which shows overall profit calculations and profit after 5 bars with the option to show the profits in pips (EUR-USD style) for FOREX,สคริปต์โอเพนซอร์ซ
ด้วยเจตนารมณ์หลักของ TradingView ผู้สร้างสคริปต์นี้ได้ทำให้เป็นโอเพนซอร์ส เพื่อให้เทรดเดอร์สามารถตรวจสอบและยืนยันฟังก์ชันการทำงานของมันได้ ขอชื่นชมผู้เขียน! แม้ว่าคุณจะใช้งานได้ฟรี แต่โปรดจำไว้ว่าการเผยแพร่โค้ดซ้ำจะต้องเป็นไปตาม กฎระเบียบการใช้งาน ของเรา
คำจำกัดสิทธิ์ความรับผิดชอบ
ข้อมูลและบทความไม่ได้มีวัตถุประสงค์เพื่อก่อให้เกิดกิจกรรมทางการเงิน, การลงทุน, การซื้อขาย, ข้อเสนอแนะ หรือคำแนะนำประเภทอื่น ๆ ที่ให้หรือรับรองโดย TradingView อ่านเพิ่มเติมใน ข้อกำหนดการใช้งาน
สคริปต์โอเพนซอร์ซ
ด้วยเจตนารมณ์หลักของ TradingView ผู้สร้างสคริปต์นี้ได้ทำให้เป็นโอเพนซอร์ส เพื่อให้เทรดเดอร์สามารถตรวจสอบและยืนยันฟังก์ชันการทำงานของมันได้ ขอชื่นชมผู้เขียน! แม้ว่าคุณจะใช้งานได้ฟรี แต่โปรดจำไว้ว่าการเผยแพร่โค้ดซ้ำจะต้องเป็นไปตาม กฎระเบียบการใช้งาน ของเรา
คำจำกัดสิทธิ์ความรับผิดชอบ
ข้อมูลและบทความไม่ได้มีวัตถุประสงค์เพื่อก่อให้เกิดกิจกรรมทางการเงิน, การลงทุน, การซื้อขาย, ข้อเสนอแนะ หรือคำแนะนำประเภทอื่น ๆ ที่ให้หรือรับรองโดย TradingView อ่านเพิ่มเติมใน ข้อกำหนดการใช้งาน