PROTECTED SOURCE SCRIPT
Intraday Market Sentiment @LogicQuest
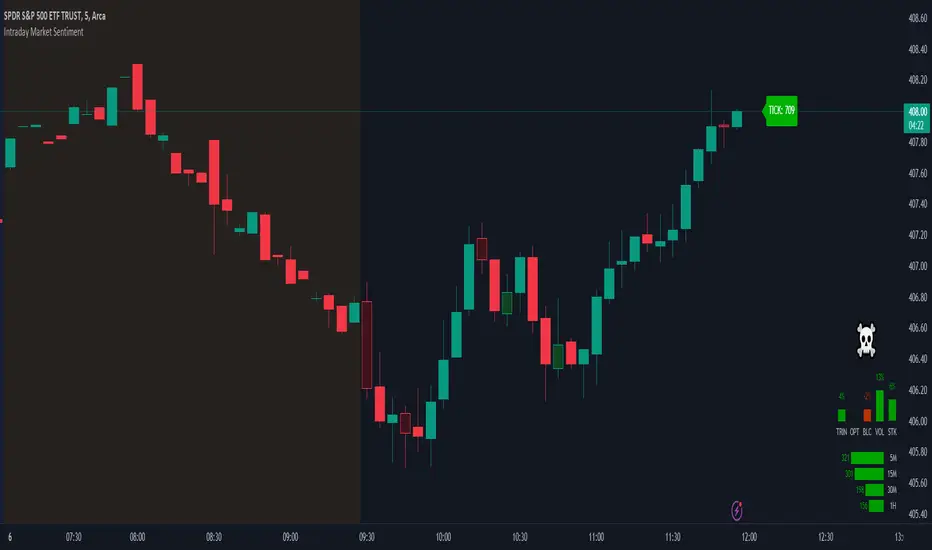
The indicator is designed for use on US stock exchanges during the main trading session. The indicator is a tool for analyzing intraday sentiment in the stock market.
The indicator displays the difference between buying and selling volumes based on the following metrics.
1. TICK - average tick data values for specific time intervals.
2. TRIN (short arbitrage index) - detecting buying and selling pressure and possible trend reversal points.
3. Options - the ratio of purchased and sold option contracts.
4. Blocks - the ratio between the number of shares bought and sold in large blocks.
5. Volumes - the ratio between buying and selling volume.
6. Stocks - the ratio between the number of rising and falling stocks.
7. Price divergence and tick volume.
The data calculation on the chart depends on the settings chosen by the user.
สคริปต์ที่ได้รับการป้องกัน
สคริปต์นี้ถูกเผยแพร่เป็นแบบ closed-source อย่างไรก็ตาม คุณสามารถใช้ได้อย่างอิสระและไม่มีข้อจำกัดใดๆ – เรียนรู้เพิ่มเติมได้ที่นี่
คำจำกัดสิทธิ์ความรับผิดชอบ
ข้อมูลและบทความไม่ได้มีวัตถุประสงค์เพื่อก่อให้เกิดกิจกรรมทางการเงิน, การลงทุน, การซื้อขาย, ข้อเสนอแนะ หรือคำแนะนำประเภทอื่น ๆ ที่ให้หรือรับรองโดย TradingView อ่านเพิ่มเติมใน ข้อกำหนดการใช้งาน