OPEN-SOURCE SCRIPT
Ali Perşembenin kitaplarından esinlenerek indikatör takibi.
## How to Use – Scoring-Based Detailed Analysis Panel
This indicator provides a **comprehensive scoring system** by combining multiple technical indicators. It helps traders quickly assess whether the market is leaning bullish, bearish, or neutral, and displays the result in a **visual table panel**.
---
### 📊 What It Does
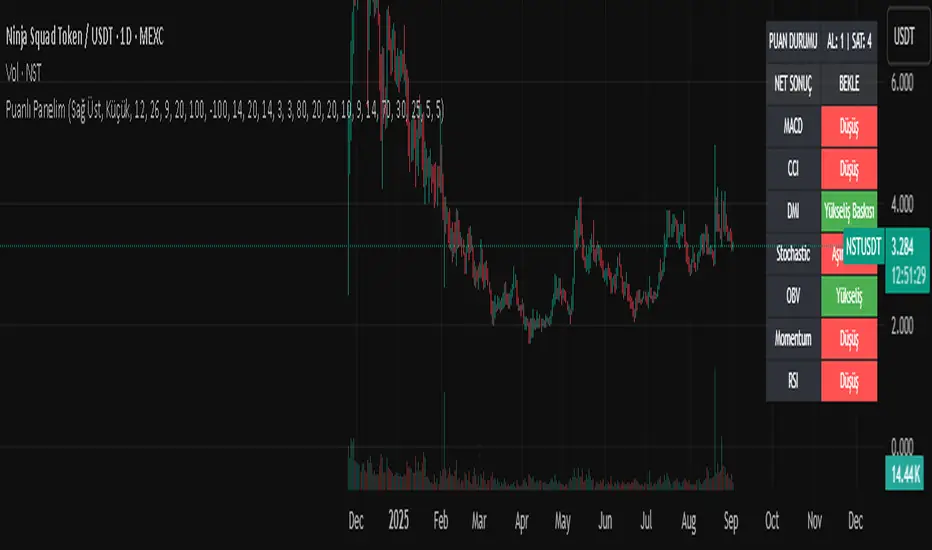
* Monitors **7 popular indicators** (MACD, CCI, DMI, Stochastic, OBV, Momentum, RSI)
* Assigns **bullish or bearish points** depending on indicator conditions
* Detects **divergences (MACD & RSI)** and adds them into the score
* Calculates a **final net score** and provides a suggestion:
* **BUY** (if score ≥ Buy threshold)
* **SELL** (if score ≤ –Sell threshold)
* **WAIT** (otherwise)
* Results are displayed in a **customizable panel** (position & size).
---
### ⚙️ Settings
* **Show/Hide Indicators** – Choose which indicators to include in scoring
* **Parameters** – Adjust lengths, thresholds, and levels individually
* **Scoring Thresholds** – Define how many points are required for BUY/SELL signals
* **Table Options** – Change panel position and text size for easier readability
---
### 🧮 Indicator Purposes
Each indicator serves a different role in technical analysis:
* **MACD (Moving Average Convergence Divergence):** Measures trend direction and momentum. Bullish when MACD line crosses above the signal line, bearish when below.
* **CCI (Commodity Channel Index):** Detects overbought/oversold levels and potential reversals. Values above +100 suggest overbought, below –100 oversold.
* **DMI / ADX (Directional Movement Index):** Identifies whether the market is trending and if bulls or bears are stronger. ADX confirms trend strength.
* **Stochastic Oscillator:** Compares closing price to price range over time. Indicates overbought (>80) or oversold (<20) and generates buy/sell crossovers.
* **OBV (On-Balance Volume):** Tracks volume flow to confirm price trends. Rising OBV suggests accumulation (bullish), falling OBV suggests distribution (bearish).
* **Momentum:** Measures the speed of price changes. Increasing momentum suggests strengthening trend; decreasing momentum indicates weakening.
* **RSI (Relative Strength Index):** Identifies overbought (>70) or oversold (<30) conditions, as well as trend direction around the 50 line. Divergences often signal reversals.
---
### ✅ How to Use
1. Apply the indicator to your chart.
2. Check the **panel on the right** for current bullish vs bearish scores.
3. Watch the **final signal (BUY, SELL, or WAIT)** as a quick market overview.
4. Always combine with **price action, support/resistance, and your own strategy** for confirmation.
---
### ⚠️ Disclaimer
This indicator is for **educational and informational purposes only**.
It is **not financial advice** and does not guarantee profits. Use proper risk management and test thoroughly before trading live.
---
This indicator provides a **comprehensive scoring system** by combining multiple technical indicators. It helps traders quickly assess whether the market is leaning bullish, bearish, or neutral, and displays the result in a **visual table panel**.
---
### 📊 What It Does
* Monitors **7 popular indicators** (MACD, CCI, DMI, Stochastic, OBV, Momentum, RSI)
* Assigns **bullish or bearish points** depending on indicator conditions
* Detects **divergences (MACD & RSI)** and adds them into the score
* Calculates a **final net score** and provides a suggestion:
* **BUY** (if score ≥ Buy threshold)
* **SELL** (if score ≤ –Sell threshold)
* **WAIT** (otherwise)
* Results are displayed in a **customizable panel** (position & size).
---
### ⚙️ Settings
* **Show/Hide Indicators** – Choose which indicators to include in scoring
* **Parameters** – Adjust lengths, thresholds, and levels individually
* **Scoring Thresholds** – Define how many points are required for BUY/SELL signals
* **Table Options** – Change panel position and text size for easier readability
---
### 🧮 Indicator Purposes
Each indicator serves a different role in technical analysis:
* **MACD (Moving Average Convergence Divergence):** Measures trend direction and momentum. Bullish when MACD line crosses above the signal line, bearish when below.
* **CCI (Commodity Channel Index):** Detects overbought/oversold levels and potential reversals. Values above +100 suggest overbought, below –100 oversold.
* **DMI / ADX (Directional Movement Index):** Identifies whether the market is trending and if bulls or bears are stronger. ADX confirms trend strength.
* **Stochastic Oscillator:** Compares closing price to price range over time. Indicates overbought (>80) or oversold (<20) and generates buy/sell crossovers.
* **OBV (On-Balance Volume):** Tracks volume flow to confirm price trends. Rising OBV suggests accumulation (bullish), falling OBV suggests distribution (bearish).
* **Momentum:** Measures the speed of price changes. Increasing momentum suggests strengthening trend; decreasing momentum indicates weakening.
* **RSI (Relative Strength Index):** Identifies overbought (>70) or oversold (<30) conditions, as well as trend direction around the 50 line. Divergences often signal reversals.
---
### ✅ How to Use
1. Apply the indicator to your chart.
2. Check the **panel on the right** for current bullish vs bearish scores.
3. Watch the **final signal (BUY, SELL, or WAIT)** as a quick market overview.
4. Always combine with **price action, support/resistance, and your own strategy** for confirmation.
---
### ⚠️ Disclaimer
This indicator is for **educational and informational purposes only**.
It is **not financial advice** and does not guarantee profits. Use proper risk management and test thoroughly before trading live.
---
สคริปต์โอเพนซอร์ซ
ด้วยเจตนารมณ์หลักของ TradingView ผู้สร้างสคริปต์นี้ได้ทำให้มันเป็นโอเพ่นซอร์ส เพื่อให้เทรดเดอร์สามารถตรวจสอบและยืนยันการทำงานของสคริปต์ได้ ขอแสดงความชื่นชมผู้เขียน! แม้ว่าคุณจะสามารถใช้งานได้ฟรี แต่อย่าลืมว่าการเผยแพร่โค้ดซ้ำนั้นจะต้องเป็นไปตามกฎระเบียบการใช้งานของเรา
คำจำกัดสิทธิ์ความรับผิดชอบ
ข้อมูลและบทความไม่ได้มีวัตถุประสงค์เพื่อก่อให้เกิดกิจกรรมทางการเงิน, การลงทุน, การซื้อขาย, ข้อเสนอแนะ หรือคำแนะนำประเภทอื่น ๆ ที่ให้หรือรับรองโดย TradingView อ่านเพิ่มเติมที่ ข้อกำหนดการใช้งาน