OPEN-SOURCE SCRIPT
RSI Multi Time Frame

What it is
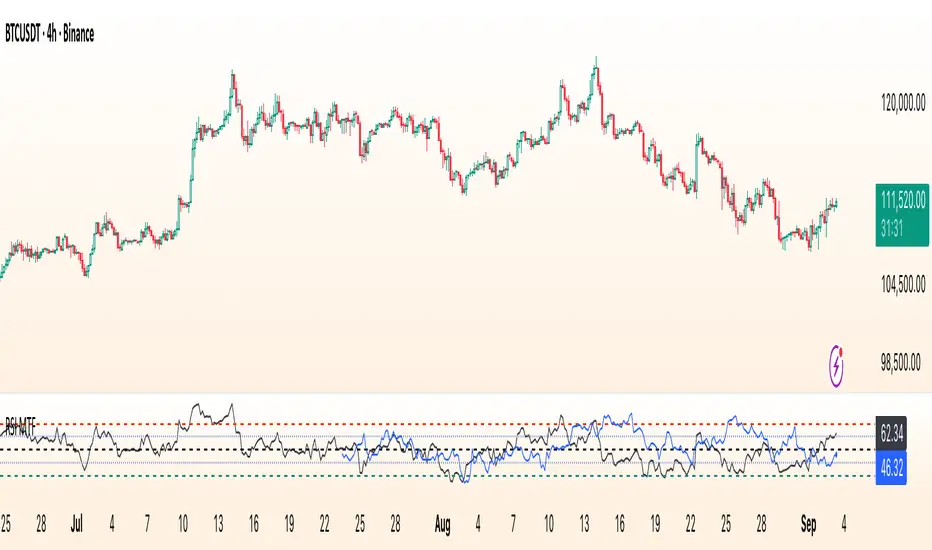
A clean, two-layer RSI that shows your chart-timeframe RSI together with a higher-timeframe (HTF) RSI on the same pane. The HTF line is drawn as a live segment plus frozen “steps” for each completed HTF bar, so you can see where the higher timeframe momentum held during your lower-timeframe bars.
How it works
Auto HTF mapping (when “Auto” is selected):
The HTF series is requested with request.security(..., gaps_off, lookahead_off), so values are confirmed bar-by-bar. When a new HTF bar begins, the previous value is “frozen” as a horizontal segment; the current HTF value is shown by a short moving segment and a small dot (so you can read the last value easily).
Visuals
Inputs
Reading it
This is a context indicator, not a signal generator. Combine with your entry/exit rules.
Notes & limitations
HTF values do not repaint after their bar closes (lookahead is off). The short “live” segment will evolve until the HTF bar closes — this is expected.
Very small panels or extremely long histories may impact performance if you keep a large number of HTF segments.
Credits
Original concept by LonesomeTheBlue; Pine v6 refactor and auto-mapping rules by trading_mura.
Suggested use
Day traders: run the indicator on 5–15m and keep HTF on Auto to see 1h/4h momentum.
Swing traders: run it on 1h–4h and watch the daily HTF.
Position traders: run on daily and watch the weekly HTF.
If you find it useful, a ⭐ helps others discover it.
A clean, two-layer RSI that shows your chart-timeframe RSI together with a higher-timeframe (HTF) RSI on the same pane. The HTF line is drawn as a live segment plus frozen “steps” for each completed HTF bar, so you can see where the higher timeframe momentum held during your lower-timeframe bars.
How it works
Auto HTF mapping (when “Auto” is selected):
- Intraday < 30m → uses 60m (1-hour) RSI
- 30m ≤ tf < 240m (4h) → uses 240m (4-hour) RSI
- 240m ≤ tf < 1D → uses 1D RSI
- 1D → uses 1W RSI
- 1W or 2W → uses 1M RSI
- ≥ 1M → keeps the same timeframe
The HTF series is requested with request.security(..., gaps_off, lookahead_off), so values are confirmed bar-by-bar. When a new HTF bar begins, the previous value is “frozen” as a horizontal segment; the current HTF value is shown by a short moving segment and a small dot (so you can read the last value easily).
Visuals
- Current RSI (chart TF): solid line (color/width configurable).
- HTF RSI: same-pane line + tiny circle for the latest value; historical step segments show completed HTF bars.
- Guides: dashed 70 / 30 bands, dotted 60/40 helpers, dashed 50 midline.
Inputs
- Higher Time Frame: Auto or a fixed TF (1, 3, 5, 10, 15, 30, 45, 60, 120, 180, 240, 360, 480, 720, D, W, 2W, M, 3M, 6M, 12M).
- Length: RSI period (default 14).
- Source: price source for RSI.
- RSI / HTF RSI colors & widths.
- Number of HTF RSI Bars: how many frozen HTF segments to keep.
Reading it
- Alignment: When RSI (current TF) and HTF RSI both push in the same direction, momentum is aligned across frames.
- Divergence across frames: Current RSI failing to confirm HTF direction can warn about chops or early slowdowns.
- Zones: 70/30 boundaries for classic overbought/oversold; 60/40 can be used as trend bias rails; 50 is the balance line.
This is a context indicator, not a signal generator. Combine with your entry/exit rules.
Notes & limitations
HTF values do not repaint after their bar closes (lookahead is off). The short “live” segment will evolve until the HTF bar closes — this is expected.
Very small panels or extremely long histories may impact performance if you keep a large number of HTF segments.
Credits
Original concept by LonesomeTheBlue; Pine v6 refactor and auto-mapping rules by trading_mura.
Suggested use
Day traders: run the indicator on 5–15m and keep HTF on Auto to see 1h/4h momentum.
Swing traders: run it on 1h–4h and watch the daily HTF.
Position traders: run on daily and watch the weekly HTF.
If you find it useful, a ⭐ helps others discover it.
สคริปต์โอเพนซอร์ซ
ด้วยเจตนารมณ์หลักของ TradingView ผู้สร้างสคริปต์นี้ได้ทำให้เป็นโอเพนซอร์ส เพื่อให้เทรดเดอร์สามารถตรวจสอบและยืนยันฟังก์ชันการทำงานของมันได้ ขอชื่นชมผู้เขียน! แม้ว่าคุณจะใช้งานได้ฟรี แต่โปรดจำไว้ว่าการเผยแพร่โค้ดซ้ำจะต้องเป็นไปตาม กฎระเบียบการใช้งาน ของเรา
✅My Telegram
t.me/charyyevn
t.me/charyyevn
คำจำกัดสิทธิ์ความรับผิดชอบ
ข้อมูลและบทความไม่ได้มีวัตถุประสงค์เพื่อก่อให้เกิดกิจกรรมทางการเงิน, การลงทุน, การซื้อขาย, ข้อเสนอแนะ หรือคำแนะนำประเภทอื่น ๆ ที่ให้หรือรับรองโดย TradingView อ่านเพิ่มเติมใน ข้อกำหนดการใช้งาน