YK_28CRYPTO_CCI_Custom
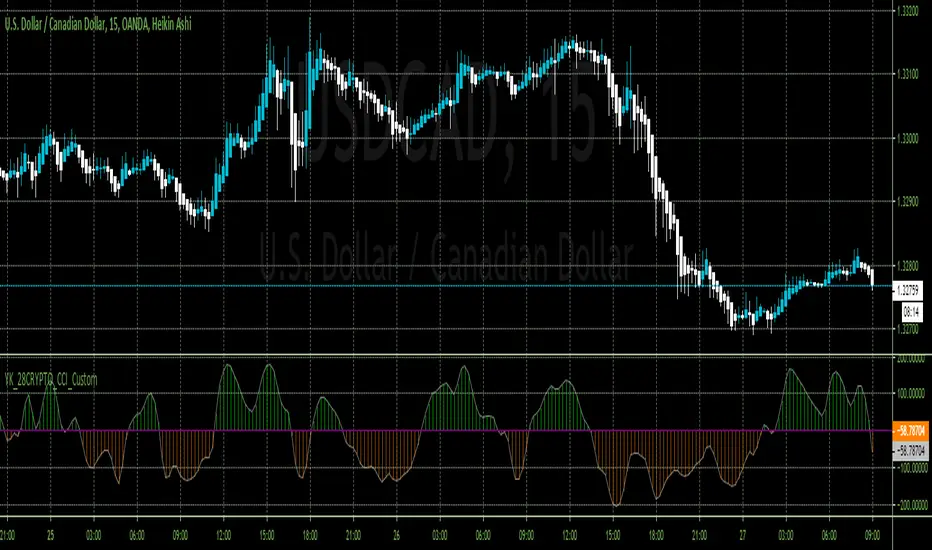
The CCI usually falls in a channel of -100 to 100. The conventional CCI trading system works as follows. When it rises above 100, buy and hold until CCI falls back below 100. When CCI falls below -100, sell short and cover the short when it rises above the -100 line. Some trading systems cover on a rise above minus 85. The following scans represent this strategy.
Buy Signal CCI > 100 AND CCI.1 <= 100
Sell Signal CCI < -100 AND CCI.1 >= -100
A more aggressive use of the CCI indicator dictates entering positions when the index crosses the 0 line. This method helps incorporate the early part of a new move. When the CCI crosses above the 0 line from negative territory, this is a bullish signal. When the CCI crosses below the 0 line from positive territory, this is a bearish signal.
Buy Signal CCI > 0 AND CCI.1 <= 0
Sell Signal CCI < 0 AND CCI.1 >= 0
Modified CCI When "Modified CCI" is checked, the Typical Price is calculated differently, as seen below. Otherwise, the calculations are identical.
TP = (Max(HI,n) + Min(LO,n) + CL) / 3 n = CCI Period TP stands for Typical Price
Also long trades should be supported in combination with RSI going above 40 for Forex and above 50 for Crypto
Same for short trades 40/30 correlated
สคริปต์แบบเฉพาะผู้ได้รับเชิญเท่านั้น
เฉพาะผู้ใช้ที่ได้รับการอนุมัติจากผู้เขียนเท่านั้นที่สามารถเข้าถึงสคริปต์นี้ได้ คุณจะต้องร้องขอและได้รับอนุญาตก่อนจึงจะสามารถใช้งานได้ โดยปกติจะได้รับอนุญาตหลังจากชำระเงินแล้ว สำหรับรายละเอียดเพิ่มเติม ทำตามคำแนะนำของผู้เขียนด้านล่างหรือติดต่อ Senin โดยตรง
TradingView ไม่แนะนำให้ชำระเงินหรือใช้สคริปต์ เว้นแต่ว่าคุณจะเชื่อถือผู้เขียนสคริปต์และเข้าใจวิธีการทำงานของมัน คุณยังอาจพบทางเลือกของโอเพนซอร์ส แบบฟรีในสคริปต์ชุมชนของเรา
คำแนะนำของผู้เขียน
คำจำกัดสิทธิ์ความรับผิดชอบ
สคริปต์แบบเฉพาะผู้ได้รับเชิญเท่านั้น
เฉพาะผู้ใช้ที่ได้รับการอนุมัติจากผู้เขียนเท่านั้นที่สามารถเข้าถึงสคริปต์นี้ได้ คุณจะต้องร้องขอและได้รับอนุญาตก่อนจึงจะสามารถใช้งานได้ โดยปกติจะได้รับอนุญาตหลังจากชำระเงินแล้ว สำหรับรายละเอียดเพิ่มเติม ทำตามคำแนะนำของผู้เขียนด้านล่างหรือติดต่อ Senin โดยตรง
TradingView ไม่แนะนำให้ชำระเงินหรือใช้สคริปต์ เว้นแต่ว่าคุณจะเชื่อถือผู้เขียนสคริปต์และเข้าใจวิธีการทำงานของมัน คุณยังอาจพบทางเลือกของโอเพนซอร์ส แบบฟรีในสคริปต์ชุมชนของเรา