OPEN-SOURCE SCRIPT
VIX > 20/25 Highlight
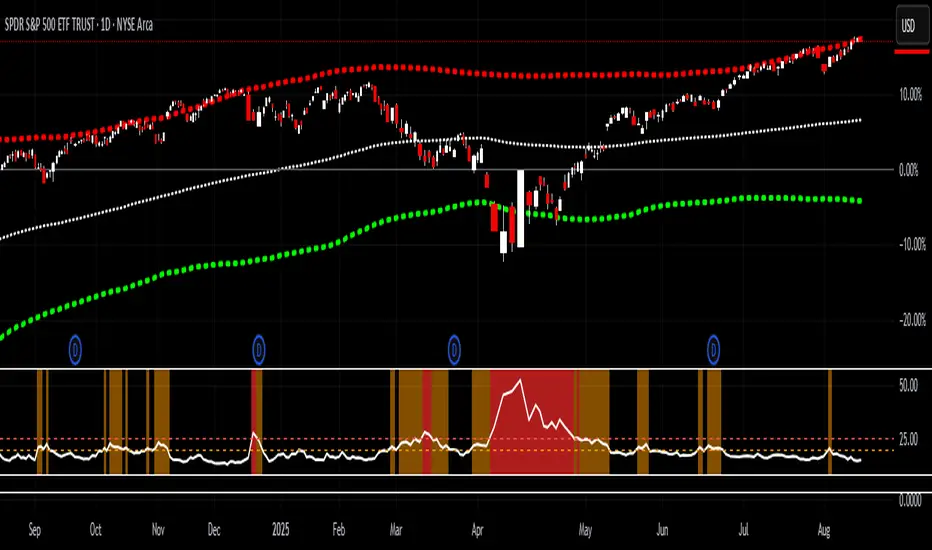
This indicator tracks the CBOE Volatility Index (VIX) and highlights when volatility exceeds critical thresholds.
Plots the VIX with dashed reference lines at 20 and 25.
Background turns orange when the VIX is above 20.
Background turns bright red when the VIX is above 25.
Includes alert conditions to notify you when the VIX crosses above 20 or 25.
Use this tool to quickly visualize periods of elevated market stress and manage risk accordingly.
สคริปต์โอเพนซอร์ซ
ด้วยเจตนารมณ์หลักของ TradingView ผู้สร้างสคริปต์นี้ได้ทำให้เป็นโอเพนซอร์ส เพื่อให้เทรดเดอร์สามารถตรวจสอบและยืนยันฟังก์ชันการทำงานของมันได้ ขอชื่นชมผู้เขียน! แม้ว่าคุณจะใช้งานได้ฟรี แต่โปรดจำไว้ว่าการเผยแพร่โค้ดซ้ำจะต้องเป็นไปตาม กฎระเบียบการใช้งาน ของเรา
คำจำกัดสิทธิ์ความรับผิดชอบ
ข้อมูลและบทความไม่ได้มีวัตถุประสงค์เพื่อก่อให้เกิดกิจกรรมทางการเงิน, การลงทุน, การซื้อขาย, ข้อเสนอแนะ หรือคำแนะนำประเภทอื่น ๆ ที่ให้หรือรับรองโดย TradingView อ่านเพิ่มเติมใน ข้อกำหนดการใช้งาน