OPEN-SOURCE SCRIPT
RSRS (Resistance Support Relative Strength)
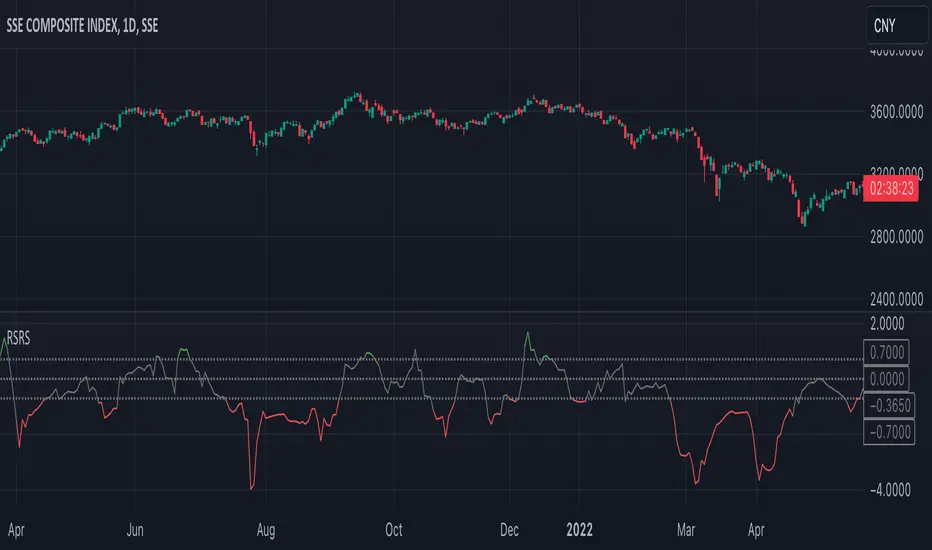
The Resistance Support Relative Strength (RSRS) indicator, published by Everbright Securities, is a technical analysis tool that enjoys immense popularity among Chinese quantitative traders, owing to its stellar performance in China's stock markets.
🟠 Principle
The indicator treats daily highs and lows as resistance and support levels respectively. It measures market strength by comparing the magnitude of price changes in daily highs versus lows. Specifically, it fits a linear regression model to the (low, high) data points over the past N days (typically 18) and uses the slope (beta) as the RSRS value. A steeper slope indicates stronger market strength.
🟠 Algorithm
1. Collect the daily low and high prices over the past N days.
2. Apply Ordinary Least Squares to estimate the linear regression model: high = alpha + beta * low. The beta is the RSRS value.
3. Compute the z-score of the RSRS over the past M days (typically 600).
4. Compare the z-score to preset buy and sell thresholds (typically 0.7 and -0.7) to generate trading signals. If z-score > buy threshold, a buy signal is triggered. If z-score < sell threshold, a sell signal is triggered.
สคริปต์โอเพนซอร์ซ
ด้วยเจตนารมณ์หลักของ TradingView ผู้เขียนสคริปต์นี้ได้เผยแพร่เป็นโอเพนซอร์ส เพื่อให้เทรดเดอร์สามารถเข้าใจและตรวจสอบได้ ต้องขอบคุณผู้เขียน! ที่ให้คุณใช้ได้ฟรี แต่การนำโค้ดนี้ไปใช้ในการเผยแพร่ซ้ำจะต้องอยู่ภายใต้ กฎระเบียบการใช้งาน คุณสามารถตั้งเป็นรายการโปรดเพื่อใช้บนชาร์ตได้
专业缠论指标: alphaviz.pro/chanlun
Email: contact@alphaviz.pro
Discord: discord.gg/w2fFtNega4
Email: contact@alphaviz.pro
Discord: discord.gg/w2fFtNega4
คำจำกัดสิทธิ์ความรับผิดชอบ
ข้อมูลและบทความไม่ได้มีวัตถุประสงค์เพื่อก่อให้เกิดกิจกรรมทางการเงิน, การลงทุน, การซื้อขาย, ข้อเสนอแนะ หรือคำแนะนำประเภทอื่น ๆ ที่ให้หรือรับรองโดย TradingView อ่านเพิ่มเติมที่ ข้อกำหนดการใช้งาน