PROTECTED SOURCE SCRIPT
ที่อัปเดต: Jack Corsellis RS Line
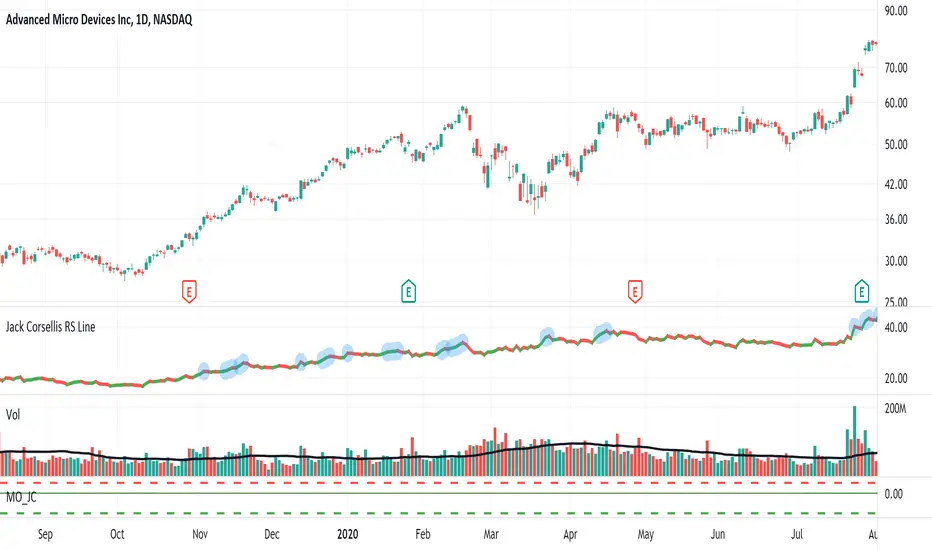
Relative Strength line which shows a blue dot for new 52 week Relative Strength highs.
เอกสารเผยแพร่
Jack Corsellis RS Line Rev 1เอกสารเผยแพร่
New update.Consistent 52 week blue dot high on daily, weekly and monthly.
No blue dots intraday.
เอกสารเผยแพร่
Revisions:1. Added the ability to plot a simple moving average (SMA) of the relative strength line.
This default is OFF (not displayed) and can be toggled ON (displayed) within the options.
The default SMA length is set to 50 days and can be configured within the options.
เอกสารเผยแพร่
Updated chart screenshotเอกสารเผยแพร่
Updated screenshotเอกสารเผยแพร่
Added Red Dot Low on Daily, Weekly and Monthly timeframes. No red dots will be displayed on intraday timeframes.Default look back period for lows is set to 52 weeks.
Indicator settings allow for this period to be configured, visibility of dot to be toggled and appearance to be changed.
สคริปต์ที่ได้รับการป้องกัน
สคริปต์นี้ถูกเผยแพร่เป็นแบบ closed-source อย่างไรก็ตาม คุณสามารถใช้ได้อย่างอิสระและไม่มีข้อจำกัดใดๆ – เรียนรู้เพิ่มเติมได้ที่นี่
คำจำกัดสิทธิ์ความรับผิดชอบ
ข้อมูลและบทความไม่ได้มีวัตถุประสงค์เพื่อก่อให้เกิดกิจกรรมทางการเงิน, การลงทุน, การซื้อขาย, ข้อเสนอแนะ หรือคำแนะนำประเภทอื่น ๆ ที่ให้หรือรับรองโดย TradingView อ่านเพิ่มเติมใน ข้อกำหนดการใช้งาน