OPEN-SOURCE SCRIPT
ที่อัปเดต: Key Levels
Key Levels Indicator
In the world of trading, manually identifying and plotting key levels for every close can be a tedious and error-prone task. This indicator stands out by automatically detecting and plotting only those levels where a significant shift in market sentiment has occurred. Unlike traditional indicators that plot lines for every open or close, this tool focuses on levels where liquidity has changed hands, indicating a potential shift in momentum.
How It Works:
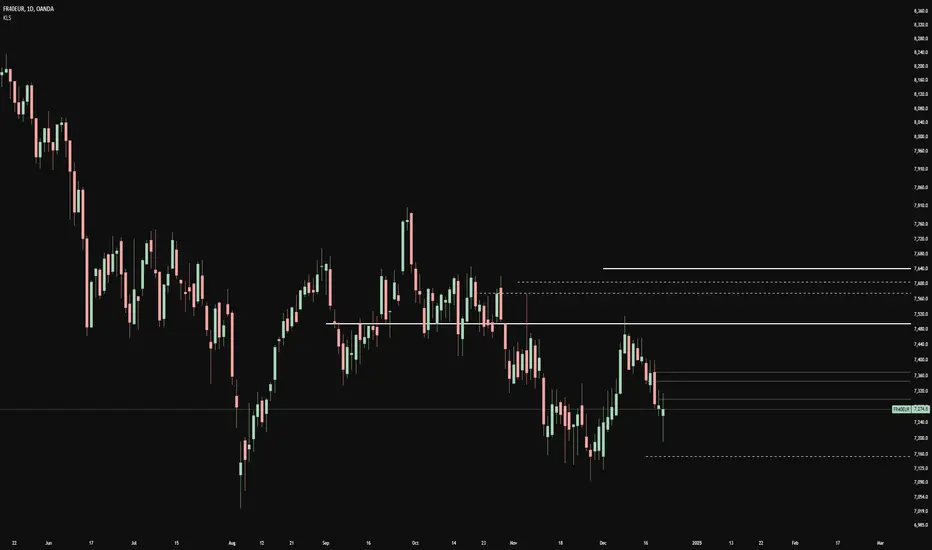
- The indicator identifies Higher Timeframe (HTF) reversals, plotting levels only when a bearish candle is followed by a bullish one, or vice versa.
- Weekly levels are represented by dashed lines, while monthly levels are solid, providing clear visual differentiation.
- Levels are drawn at the open price of the reversal candle, starting precisely at the beginning of the new HTF bar.
Why It's Different:
- Focuses on genuine shifts in market sentiment rather than arbitrary price points.
- Automatically manages the number of visible levels to prevent chart clutter.
- Ideal for range traders and mean reversion strategies, offering insights into potential support and resistance zones where market participants have shown a change in behavior.
Usage Note:
While this indicator provides valuable insights, it should not be used in isolation. Always consider the broader market context and combine it with other analysis techniques for optimal results.
Settings:
- Toggle weekly/monthly levels
- Adjust the number of visible levels (1-20)
- Customize level colors
In the world of trading, manually identifying and plotting key levels for every close can be a tedious and error-prone task. This indicator stands out by automatically detecting and plotting only those levels where a significant shift in market sentiment has occurred. Unlike traditional indicators that plot lines for every open or close, this tool focuses on levels where liquidity has changed hands, indicating a potential shift in momentum.
How It Works:
- The indicator identifies Higher Timeframe (HTF) reversals, plotting levels only when a bearish candle is followed by a bullish one, or vice versa.
- Weekly levels are represented by dashed lines, while monthly levels are solid, providing clear visual differentiation.
- Levels are drawn at the open price of the reversal candle, starting precisely at the beginning of the new HTF bar.
Why It's Different:
- Focuses on genuine shifts in market sentiment rather than arbitrary price points.
- Automatically manages the number of visible levels to prevent chart clutter.
- Ideal for range traders and mean reversion strategies, offering insights into potential support and resistance zones where market participants have shown a change in behavior.
Usage Note:
While this indicator provides valuable insights, it should not be used in isolation. Always consider the broader market context and combine it with other analysis techniques for optimal results.
Settings:
- Toggle weekly/monthly levels
- Adjust the number of visible levels (1-20)
- Customize level colors
เอกสารเผยแพร่
Key Levels IndicatorIn the world of trading, manually identifying and plotting key levels for every close can be a tedious and error-prone task. This indicator stands out by automatically detecting and plotting only those levels where a significant shift in market sentiment has occurred. Unlike traditional indicators that plot lines for every open or close, this tool focuses on levels where liquidity has changed hands, indicating a potential shift in momentum.
How It Works:
- The indicator identifies Higher Timeframe (HTF) reversals, plotting levels only when a bearish candle is followed by a bullish one, or vice versa.
- Weekly levels are represented by dashed lines, while monthly levels are solid, providing clear visual differentiation.
- Levels are drawn at the open price of the reversal candle, starting precisely at the beginning of the new HTF bar.
Why It's Different:
- Focuses on genuine shifts in market sentiment rather than arbitrary price points.
- Automatically manages the number of visible levels to prevent chart clutter.
- Ideal for range traders and mean reversion strategies, offering insights into potential support and resistance zones where market participants have shown a change in behavior.
Usage Note:
While this indicator provides valuable insights, it should not be used in isolation. Always consider the broader market context and combine it with other analysis techniques for optimal results.
Settings:
- Toggle weekly/monthly levels
- Adjust the number of visible levels (1-20)
- Customize level colors
- Added Custom Timeframes
เอกสารเผยแพร่
Added Custom Timeframe Levelsสคริปต์โอเพนซอร์ซ
ด้วยเจตนารมณ์หลักของ TradingView ผู้สร้างสคริปต์นี้ได้ทำให้เป็นโอเพนซอร์ส เพื่อให้เทรดเดอร์สามารถตรวจสอบและยืนยันฟังก์ชันการทำงานของมันได้ ขอชื่นชมผู้เขียน! แม้ว่าคุณจะใช้งานได้ฟรี แต่โปรดจำไว้ว่าการเผยแพร่โค้ดซ้ำจะต้องเป็นไปตาม กฎระเบียบการใช้งาน ของเรา
คำจำกัดสิทธิ์ความรับผิดชอบ
ข้อมูลและบทความไม่ได้มีวัตถุประสงค์เพื่อก่อให้เกิดกิจกรรมทางการเงิน, การลงทุน, การซื้อขาย, ข้อเสนอแนะ หรือคำแนะนำประเภทอื่น ๆ ที่ให้หรือรับรองโดย TradingView อ่านเพิ่มเติมใน ข้อกำหนดการใช้งาน
สคริปต์โอเพนซอร์ซ
ด้วยเจตนารมณ์หลักของ TradingView ผู้สร้างสคริปต์นี้ได้ทำให้เป็นโอเพนซอร์ส เพื่อให้เทรดเดอร์สามารถตรวจสอบและยืนยันฟังก์ชันการทำงานของมันได้ ขอชื่นชมผู้เขียน! แม้ว่าคุณจะใช้งานได้ฟรี แต่โปรดจำไว้ว่าการเผยแพร่โค้ดซ้ำจะต้องเป็นไปตาม กฎระเบียบการใช้งาน ของเรา
คำจำกัดสิทธิ์ความรับผิดชอบ
ข้อมูลและบทความไม่ได้มีวัตถุประสงค์เพื่อก่อให้เกิดกิจกรรมทางการเงิน, การลงทุน, การซื้อขาย, ข้อเสนอแนะ หรือคำแนะนำประเภทอื่น ๆ ที่ให้หรือรับรองโดย TradingView อ่านเพิ่มเติมใน ข้อกำหนดการใช้งาน