PROTECTED SOURCE SCRIPT
ที่อัปเดต: Daily SMA200 Distance – Percentile Zones PRO
Indicator Description — Weekly/Daily SMA200 Distance – Percentile Zones
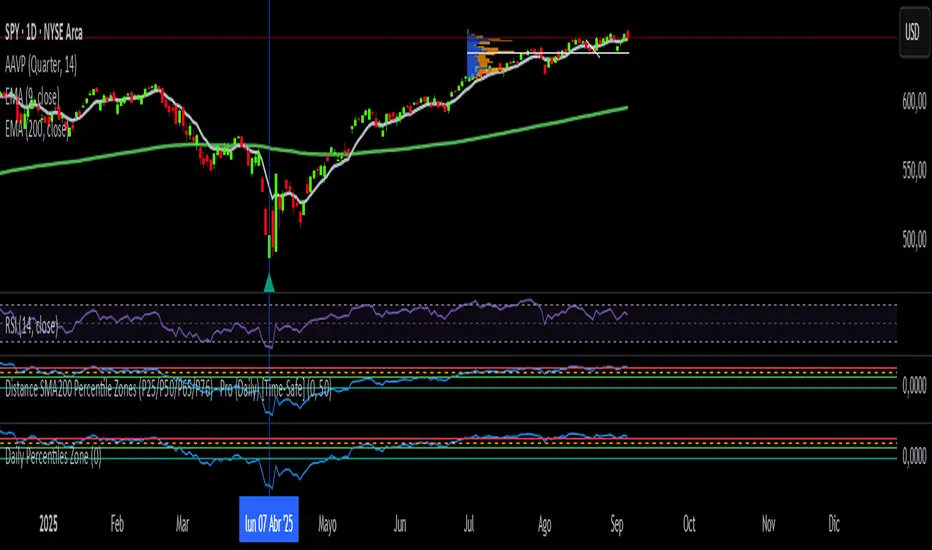
The SMA200 Distance – Percentile Zones indicator measures the percentage distance between the price and its 200-period Simple Moving Average (SMA200), and classifies it into historical percentile zones.
This tool helps traders and investors understand the market context of an asset relative to its long-term trend:
Cheap Zone (< P25): price at historically low levels compared to SMA200.
Value Zone (P25–P50): neutral range, where price trades around its long-term average.
Acceptable Zone (P50–P65): moderately high levels, still reasonable within an uptrend.
Not Recommended Zone (P65–P76): overextended territory, with increasing correction risk.
Very Expensive Zone (≥ P76): extreme levels, historically linked to overvaluation and potential market tops.
Percentiles are calculated dynamically from the entire historical dataset (since the SMA200 becomes available), providing a robust and objective statistical framework for decision-making.
✅ In summary:
This indicator works as a quantitative valuation map — showing whether the asset is cheap, fairly valued, acceptable, risky, or very expensive relative to its historical behavior against the SMA200.
เอกสารเผยแพร่
Daily Percentiles ZoneShows the distance of price from the 200-day EMA and classifies it into historical percentiles (P25, P50, P65, P76). Helps identify whether the asset is cheap, fair value, acceptable, risky, or very expensive compared to its long-term daily trend.
สคริปต์ที่ได้รับการป้องกัน
สคริปต์นี้ถูกเผยแพร่เป็นแบบ closed-source อย่างไรก็ตาม คุณสามารถใช้ได้อย่างอิสระและไม่มีข้อจำกัดใดๆ – เรียนรู้เพิ่มเติมได้ที่นี่
คำจำกัดสิทธิ์ความรับผิดชอบ
ข้อมูลและบทความไม่ได้มีวัตถุประสงค์เพื่อก่อให้เกิดกิจกรรมทางการเงิน, การลงทุน, การซื้อขาย, ข้อเสนอแนะ หรือคำแนะนำประเภทอื่น ๆ ที่ให้หรือรับรองโดย TradingView อ่านเพิ่มเติมใน ข้อกำหนดการใช้งาน