OPEN-SOURCE SCRIPT
ที่อัปเดต: US Yield Curve (2-10yr)
US Yield Curve (2-10yr) by oonoon
2-10Y US Yield Curve and Investment Strategies
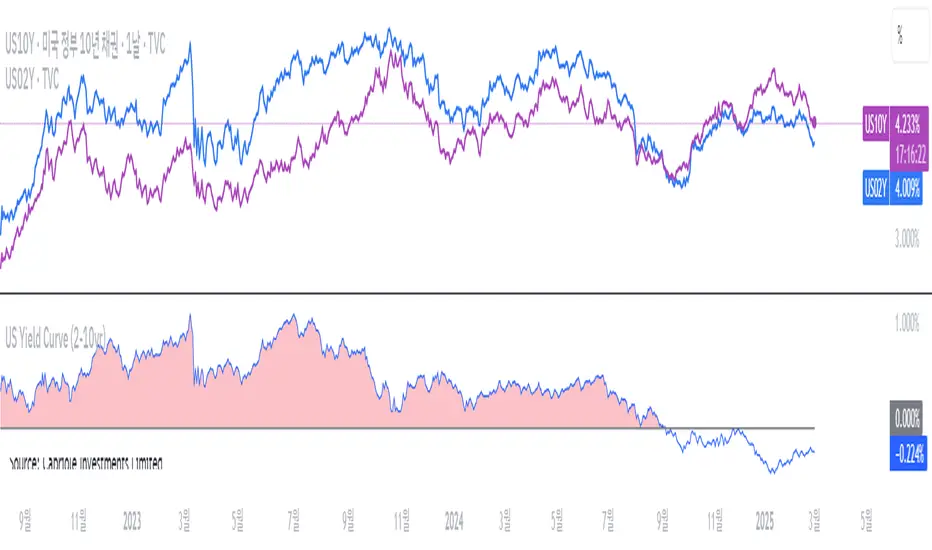
The 2-10 year US Treasury yield spread measures the difference between the 10-year and 2-year Treasury yields. It is a key indicator of economic conditions.
Inversion (Spread < 0%): When the 2-year yield exceeds the 10-year yield, it signals a potential recession. Investors may shift to long-term bonds (TLT, ZROZ), gold (GLD), or defensive stocks.
Steepening (Spread widening): A rising 10-year yield relative to the 2-year suggests economic expansion. Investors can benefit by shorting bonds (TBT) or investing in financial stocks (XLF). The Amundi US Curve Steepening 2-10Y ETF can be used to profit from this trend.
Monitoring the curve: Traders can track US10Y-US02Y on TradingView for real-time insights and adjust portfolios accordingly.
2-10Y US Yield Curve and Investment Strategies
The 2-10 year US Treasury yield spread measures the difference between the 10-year and 2-year Treasury yields. It is a key indicator of economic conditions.
Inversion (Spread < 0%): When the 2-year yield exceeds the 10-year yield, it signals a potential recession. Investors may shift to long-term bonds (TLT, ZROZ), gold (GLD), or defensive stocks.
Steepening (Spread widening): A rising 10-year yield relative to the 2-year suggests economic expansion. Investors can benefit by shorting bonds (TBT) or investing in financial stocks (XLF). The Amundi US Curve Steepening 2-10Y ETF can be used to profit from this trend.
Monitoring the curve: Traders can track US10Y-US02Y on TradingView for real-time insights and adjust portfolios accordingly.
เอกสารเผยแพร่
2-10Y US Yield Curve and Investment Strategies by oonoonThe 2-10 year US Treasury yield spread measures the difference between the 10-year and 2-year Treasury yields. It is a key indicator of economic conditions.
Inversion (Spread < 0%): When the 2-year yield exceeds the 10-year yield, it signals a potential recession. Investors may shift to long-term bonds (TLT, ZROZ), gold (GLD), or defensive stocks.
Steepening (Spread widening): A rising 10-year yield relative to the 2-year suggests economic expansion. Investors can benefit by shorting bonds (TBT) or investing in financial stocks (XLF). The Amundi US Curve Steepening 2-10Y ETF can be used to profit from this trend.
Monitoring the curve: Traders can track US10Y-US02Y on TradingView for real-time insights and adjust portfolios accordingly.
สคริปต์โอเพนซอร์ซ
ด้วยเจตนารมณ์หลักของ TradingView ผู้สร้างสคริปต์นี้ได้ทำให้เป็นโอเพนซอร์ส เพื่อให้เทรดเดอร์สามารถตรวจสอบและยืนยันฟังก์ชันการทำงานของมันได้ ขอชื่นชมผู้เขียน! แม้ว่าคุณจะใช้งานได้ฟรี แต่โปรดจำไว้ว่าการเผยแพร่โค้ดซ้ำจะต้องเป็นไปตาม กฎระเบียบการใช้งาน ของเรา
คำจำกัดสิทธิ์ความรับผิดชอบ
ข้อมูลและบทความไม่ได้มีวัตถุประสงค์เพื่อก่อให้เกิดกิจกรรมทางการเงิน, การลงทุน, การซื้อขาย, ข้อเสนอแนะ หรือคำแนะนำประเภทอื่น ๆ ที่ให้หรือรับรองโดย TradingView อ่านเพิ่มเติมใน ข้อกำหนดการใช้งาน